This report summarises the research activities and findings from the TLRI-funded project conducted in various schools entitled Building Students’ Inferential Reasoning: Statistics Curriculum Levels 5 and 6. The project was a 2-year collaboration among two statisticians, two researchers and nine teachers. The project team designed innovative approaches to develop students’ informal inferential reasoning and sought evidence that these innovations had a significant effect on improving students’ statistical reasoning in this domain.
Key findings
- Students initially used descriptive approaches to boxplot comparisons and expressed everyday conceptions of sample and population, but later moved towards thinking inferentially.
- Designed learning trajectories can lead students to “discover” a rational basis for making claims when comparing box plots.
- Students’ knowledge about distributional shapes was impoverished, but focused learning trajectories seemed to significantly improve their reasoning.
Major implications of these findings
- Building students’ statistical concepts means shifting the focus of learning from how to construct plots and calculate “mean-median-mode”, to how to reason from plots.
- Hands-on activities, using gestures and dynamic visual imagery that strongly connect sampling variability, plots and inference, make concepts more accessible for learning about decision-making under uncertainty.
- Engaging students’ imagination and contextual knowledge and developing their language to describe shape are central to improving their statistical reasoning and thinking.
Background to research
Traditionally the teaching of statistical inference starts at Year 13. However, research (e.g., Pratt & Ainley, 2008) suggests that the underlying concepts used for inference, such as population, sample and sampling variability, should be introduced much earlier. Currently a Year 11 statistics standard requires students to pose a comparison question, construct plots, analyse the data and draw a conclusion based on three pieces of evidence. Pfannkuch (2006) has noted that students did not know whether they were reasoning about the samples or about the populations from the samples, and that a rational basis for drawing a conclusion at this year level did not exist.
In response, Wild, Pfannkuch, Regan and Horton (2011) have proposed a developmental pathway for comparative situations, from Year 10 to 12, that allows students to justify making a decision about whether condition A tends to have bigger values than condition B, which we refer to here as “making a call”. These proposals were new, had many underpinning concepts and had not been trialled with students, and so questions arose about how to develop students’ inferential reasoning and whether it was within their capabilities. These questions were particularly important because the new statistics curriculum and assessment require Year 11 students to make informal inferences about populations from samples.
Methodology
The methodology employed in this study is broadly labelled design research. Such research engages researchers in improving education and provides results that can be readily used by practitioners (Bakker, 2004). There are three main features of design research:
- the aim, which is to develop theories about both learning and the instructional design that supports learning
- the interventionist nature of the methodology, whereby instructional materials are designed in an attempt to engineer and support a new type of learning and reasoning
- the iterative nature of the research, whereby attention to evidence about learning and reasoning results in the revision of learning trajectories and the trialling of new designs.
- The research was conducted over 2 years and went through two developmental cycles. In both years four classes participated: in the first year there were classes from Year 10 (two), Year 11 and Year 12; in the second year there were classes from Year 9 (two), Year 10 and Year 11. During the implementation, teachers were free to adapt and modify the designed resources and proposed learning trajectory to suit their students and their own approach to teaching. The main data collected were: pre- and post-tests, pre- and post-interviews of 14 students, videos of four classes implementing the teaching unit, and teacher reflections.
Analysis
For the pre- and post-tests, assessment frameworks were developed for five domains of reasoning: making a call, shape, spread, unusual patterns and context. A researcher and an independent helper coded the data and then reached a consensus on the final codes. A statistical analysis was then conducted. The pre- and post-interviews based on the tests were analysed qualitatively, focusing on the following domains: reasoning about samples, populations, and sampling variability.
Results
Research Question One: How can students be stimulated to start developing concepts about statistical inference?
To answer this question, we first explicitly defined and created the desired visual imagery and statistically sound decision guidelines for “making a call” about whether one box plot tended to have bigger values than another (Wild et al., 2011), and the reasoning and verbalisation goals we wanted the students to achieve (Pfannkuch, Regan, Wild, & Horton, 2010). Second, we trialled learning pathways to reach these goals. The main principles behind the instruction were as follows.
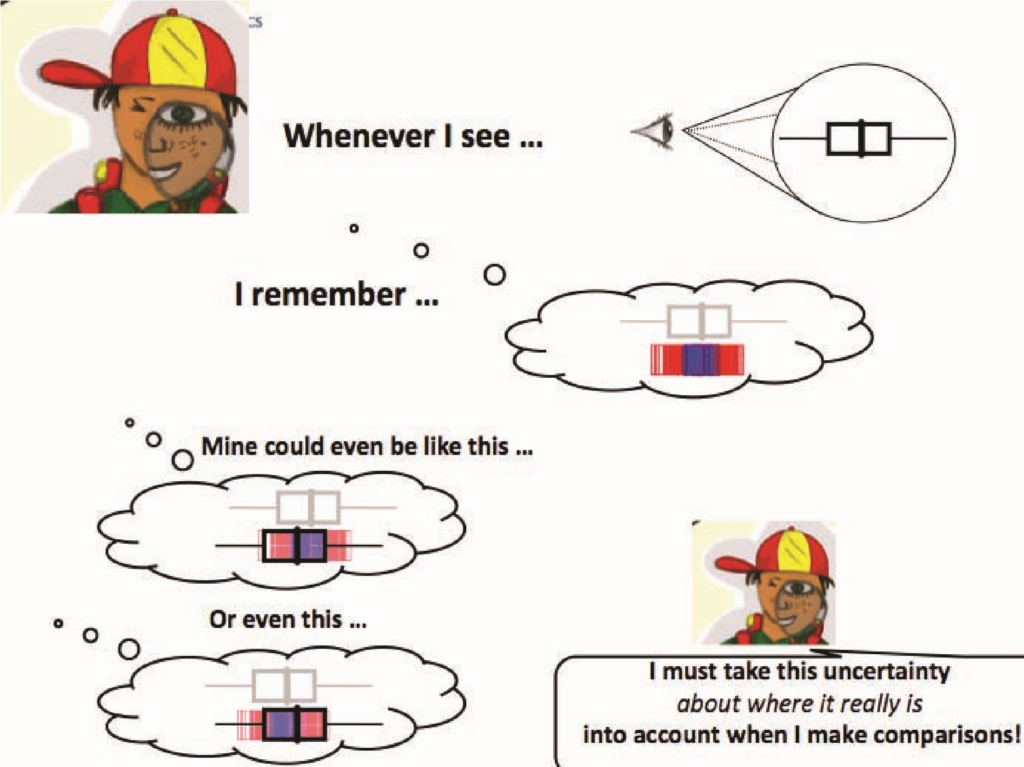
- Learners from Year 9 onwards should experience sampling behaviour using direct dynamic visual imagery that strongly connects sampling variability, sample plots and inference (Figure 1).
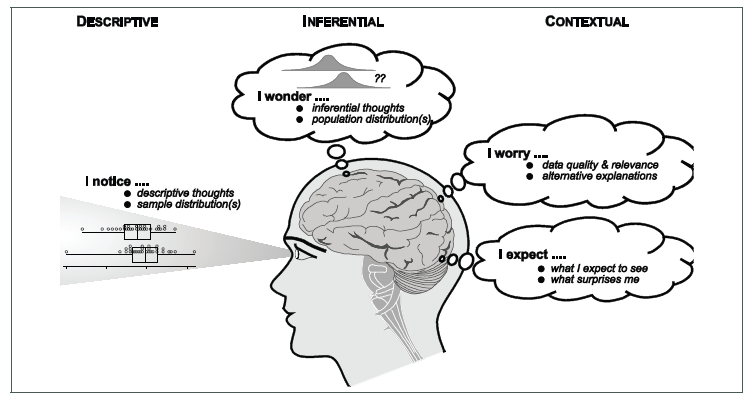
- Teachers should be aware of how to delineate descriptive, inferential and contextual thoughts (Figure 2).
- Learning trajectories should have substantial hands-on simulation activities before moving to computer environments.
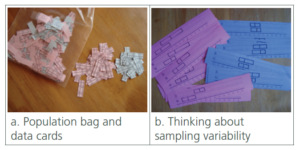
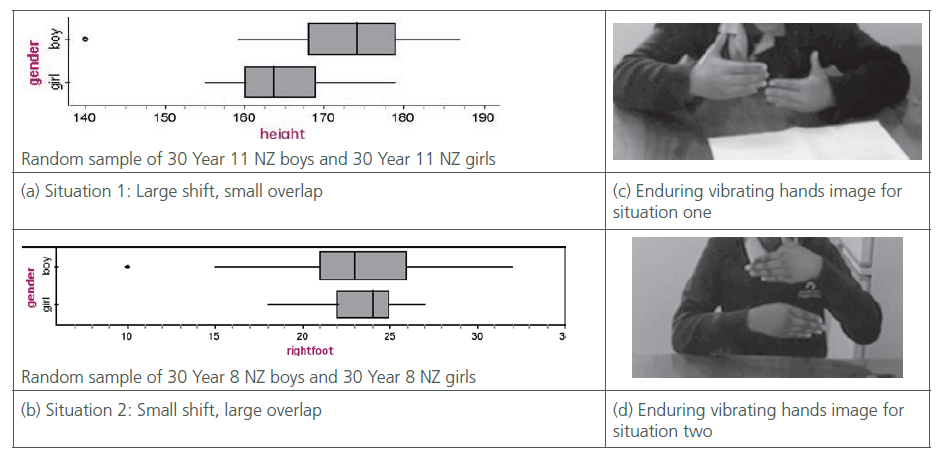
The hands-on simulation activities involved population bags of data cards, taking samples from these bags (Figure 3a), comparing different samples taken by students (Figure 3b), and then realising there were two situations, one giving a consistent message about which condition tended to have greater values back in the populations (Figure 4a) and the other an inconsistent message (Figure 4b). By recognising and reasoning from the patterns in the two situations, students were able to “discover” a rational basis for making a decision when comparing two box plots. Students then moved from hands-on to dynamic computer visualisations of the two situations, which showed multiple simulations of the comparison of two box plots, each box plot resulting from a random sample of size 30 from a population (see: www.censusatschool.org.nz/2009/informal-inference/WPRH/). When students viewed these dynamic visualisations, the vibrating box plots caused by sampling variability from sample-to-sample captured their attention and they and the teacher gestured what they were seeing with their hands (Figures 4c. and 4d). Their attention was also focussed on the message they were seeing in the data through the raising of their hands. When the message was consistent one hand stayed raised, whereas with an inconsistent message the hand raised swapped around.
In the pre-interviews, students’ initial conceptions of a sample typically related to a product sample (e.g., “like those shopping stores that give you out free samples but you only get a little bit and it’s kind of a sample”) or a part of a whole, similar to Watson’s (2006) findings. Students’ conceptions of population were mainly centred on the number of data values, akin to their thinking when they were asked, “What is the population of New Zealand?” Typically students thought a random sample was taken to get a variety of different measurements, and a sample of size 30 was insufficient to make a statement about all New Zealand students. Despite some probing, there was no evidence that they understood the relationship between samples and populations. They believed they were reasoning about the sample distributions, and not making inferences about the population distributions.
In the post-interviews, most students showed improved understanding of the relationship between samples and populations. Previously the term “population” was not part of their verbalisations, but now it was: for example, “[a sample] will give you an idea of what the population will look like, but it might not always be the same.” They were clearer about how populations were defined in statistics and that they were reasoning about all New Zealand Year 11 students (Figure 4a). They were also now fairly confident, for situations similar to Figure 4a, that they could make a call about the populations using samples of size 30. Teachers reported that the population bags acted as a useful prop to remind students that they were reasoning about populations.
When it came to sampling variability, all students knew prior to the intervention that another sample would produce slightly different plots. What they did not know was the extent of sampling variability, in the medians and quartiles of box plots or that the medians in a situation such as Figure 4b could swap around. In the post-tests and interviews, some students were able to verbalise this (e.g., “another sample could show the medians were the other way around”), or to show with their hands how the box plots would jiggle (Figure 4d). In fact these images seemed to endure. The teacher and researcher reported that the Year 11 students, who were introduced to the topic in Year 10, immediately raised their hands to show the two situations when comparing box plots (Figures 4c and 4d; see Arnold and Pfannkuch, 2010).
Research Question Two: In levels 5 and 6 of the statistics curriculum, what type and level of informal inferential reasoning can students achieve?
For making a call, the assessment framework had 12 levels of reasoning. For this report we collapsed these levels into four categories related to NCEA assessment:
- Not Achieved: makes a call on any feature that appears bigger (e.g., maximum, box length)
- Achieved: is at a critical juncture of focusing attention on the medians or central 50 percent
- Merit and Excellence: fully verbalises some or all elements of evidence (shift, overlap, decision guideline and sampling variability) for justifying a decision.
An example of an Excellence response for a situation similar to Figure 4a from a Year 11 student is:
Yes, I would make the same claim as Matt (Year 9 NZ girls rate themselves better at dancing than Year 9 NZ boys). This is because in the overall visual spread the medians are more than 1/3 apart with the girls’ median being higher.
This means that if I was able to take another sample the medians may move a little but would not swap (the girls would stay higher). There is also no overlap and the girls’ middle 50% is clearly shifted more to the right.
Note that Year 11 had a different decision guideline to Year 10, who would state that the median of the girls’ rating for dancing was outside the box of the boys. In each of the pre- and post-tests, three items assessed making a call. The average of these three items determined the students’ level of reasoning. The results from the second year are from two Year 9 classes, one Year 10 class and one Year 11 class, from decile 1, 4, 5 and 8 schools (Table 1). There was extremely strong evidence that students had improved their average reasoning scores in this domain (diff = 2.94, 95% C.I. = [2.62, 3.26], P-value ≈ 0).
| POST | Total | |||||
| Not achieved |
Achieved | Merit | Excellence | |||
| PRE | Not achieved Achieved Merit Excellence |
9 1 0 0 |
31 5 0 0 |
12 3 0 0 |
11 17 2 0 |
63 26 2 8 |
| Total | 10 | 36 | 15 | 30 | 91 | |
Post-interviews confirmed that students were beginning to grasp the concepts underlying making an inference about populations from samples. As would be expected, there were gaps and conflicts in their reasoning, such as wanting to draw multiple samples to be more confident of their call and wanting to give an answer rather than saying they could not make a call in situations similar to Figure 4b. Therefore, our research appears to show that Year 9 to 11 students—even those with low literacy and numeracy levels, as was the case in the decile 1 school—can start to verbalise and understand statistical inferential reasoning.
Research Question Three: When students experience informal inferential reasoning, what issues arise in their learning and reasoning processes?
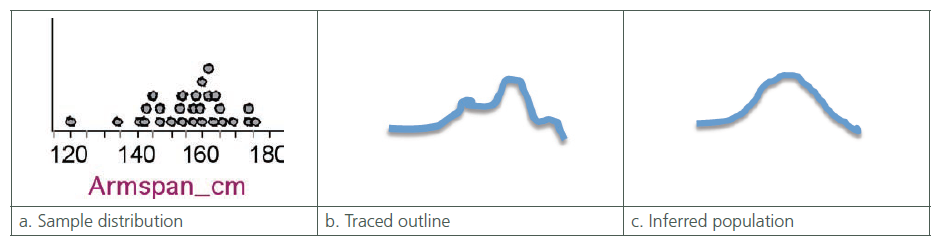
The analysis of the pre- and post-tests from the first year revealed one major issue: students’ reasoning in the domain of shape was impoverished. Many students were sketching and describing shape as an outline traced (Figure 5b) around a sample distribution (Figure 5a) rather than the inferred population shape (Figure 5c). In the pre-interviews in the second year, students were asked to predict and sketch the shape of the arm span population distribution if 30,000 arm spans were plotted. Suggested shapes revealed that students had little statistical or contextual knowledge about the expected shape.
Part of the learning trajectory trialled in the second year for engaging students in reasoning about shape encouraged use of their imagination and contextual knowledge. A teacher reported as follows:
They liked the challenge of imagining or hypothesising what they might see in their plots. They wanted to know if their investigation would prove them right. Whenever we began an investigation, we would start with not only a question, but also with a hypothesis. For example, with the weights of kiwis, I’d ask them to sketch what they expected to find, and to justify their sketch. Some argued bimodal (because of male and female), some argued for normal or bell-curved, and others worried that chicks would skew the distribution. It didn’t matter as long as students were using imagination and reasoning—imaging the context, the story behind the data, onto the shape that they might see.
Because only two classes (a Year 9 and a Year 10 class from decile 4 and 8 schools) experienced instruction specific to reasoning about shape, only their results are given. In both pre- and post-tests two items assessed describing shape. There was extremely strong evidence that students improved their average reasoning scores for shape (diff = 3.02, 95% C.I. = [2.63, 3.41], P-value ≈ 0). Hence our research seems to show that students can grow their reasoning about shape and build their knowledge to unlock the stories in the data.
Major implications
Our research appears to show that students are capable of informal inferential reasoning, can recognise and reason from patterns to “discover” how to make a call rather than “getting the rule”, and can use their imagination to reason about shape. After our learning trajectories were applied, students’ reasoning in the domains of making a call and shape significantly improved. A major implication for practice, however, is that the type of learning and conceptual pathways that we have developed for students to grow their statistical inferential reasoning is entirely new in the international arena and will require professional development for secondary teachers.
Teaching statistical reasoning means making a shift in practice from the current focus on how to construct plots and calculate “mean-median-mode”, to how to reason from plots. Stimulating such thinking skills will require attention to developing students’ conceptual foundations for inferential reasoning. Coupled with developing concepts of reasoning about the relationship between samples and populations, we will be developing students’:
- “ways of seeing” and interacting with plots
- statistical language and verbalisations
- ability to link statistical and contextual evidence
- imagination and thinking about the context in order to unlock the stories in the data.
The shift to a reasoning focus will not be easy: early on we recognised that when interrogating plots, our own verbalisations (as well as textbooks) were inadequate for communicating statistical reasoning to learners because we were mixing descriptive, inferential and contextual thinking. In other words, new ways of reasoning must be learnt by all of us. Also, the new dynamic visual imagery we created reveals concepts that were previously hidden by mathematical symbols and procedures. These new conceptual visualisations imply that technology must become an integral part of statistics teaching and learning.
Finally, our research shows impoverished student thinking in other domains of statistical reasoning. In a society that demands evidence-based thinking, and therefore that its citizens become statistically literate, there is now an urgent need for more research into growing young people’s statistical reasoning.
References
Arnold, P., & Pfannkuch, M. (2010). Enhancing students’ inferential reasoning: From hands on to “movie snapshots”. In C. Reading (Ed.), Data and context in statistics education: Towards an evidence-based society: Proceedings of the Eighth International Conference on Teaching Statistics (ICOTS-8), July 2010, Ljubljana, Slovenia . Voorburg, The Netherlands: International Statistical Institute. Retrieved from http://www.stat.auckland.ac.nz/~iase/publications.php
Pfannkuch, M., Regan, M., Wild, C. J., & Horton, N. (2010). Telling data stories: Essential dialogues for comparative reasoning. Journal of Statistics Education, 18 (1). Retrieved from http://www.amstat.org/publications/jse/v18n1/pfannkuch.pdf
Watson, J. M. (2006). Statistical literacy at school: Growth and goals . Mahwah, NJ: Lawrence Erlbaum Associates.
Wild, C. J., Pfannkuch, M., Regan, M., & Horton, N. (in press). Towards more accessible conceptions of statistical inference. Journal of the Royal Statistical Society Series A.
Resource materials:
https://www.censusatschool.org.nz/2009/informal-inference/
Project Outputs
Presentations, conferences and workshops
Ellwood, J. (2010). Developing Informal Inference at Level 6. Workshop at the Bay of Plenty Mathematics Association Teachers Day, 22 November 2010.
Pfannkuch, M., Regan, M., & Wild, C. (2010). Generalising from data. Presentation at Getstats Week, Plymouth University, Plymouth, 22-27 October 2010.
Wild, C. (2010). Early statistical inferences: “the eyes have it.” Presentation at Getstats Week, Plymouth University, Plymouth, 22-27 October 2010.
Pfannkuch, M., & Regan, M. (2010). Engaging with Shape. Workshop at Getstats Week, Plymouth University, Plymouth, 22-27 October 2010.
Pfannkuch, M., & Regan, M. (2010). Making a claim. Workshop at Getstats Week, Plymouth University, Plymouth, 22-27 October 2010.
Pfannkuch, M., Regan, M., & Wild, C. (2010). Generalising from data. Presentation at the Fourth International CensusAtSchool Workshop, Royal Statistical Society, London, 21 October 2010.
Wild, C. (2010). Early statistical inferences: “the eyes have it.” Presentation at the Fourth International CensusAtSchool Workshop, Royal Statistical Society, London, 21 October 2010.
Pfannkuch, M., & Regan, M. (2010). Engaging with Shape. Workshop at the Fourth International CensusAtSchool Workshop, Royal Statistical Society, London, 21 October 2010.
Pfannkuch, M., & Regan, M. (2010). Making a claim. Workshop at the Fourth International CensusAtSchool Workshop, Royal Statistical Society, London, 21 October 2010.
Wild, C., Pfannkuch, M., Regan, M., & Horton, N. (2010). Towards more accessible conceptions of statistical inference. Paper presented by Chris Wild at the launch of the UK 10-year statistical literacy campaign, World Statistics Day, Royal Statistical Society, London, 20 October 2010.
Pfannkuch, M., Arnold, P., Wright, S., Florence, J., Ellwood, J., Smith, L. & McFarland, M. (2010). Developing inferential reasoning: Stories from Statistics classes. Presentation followed by Workshops at the Auckland Mathematical Association Statistics Teachers Day, 2 December 2010. www.censusatschool.org.nz/2009/informal-inference/
Wild, C., Pfannkuch, M., Regan, M., & Horton, N. (2010). Towards more accessible conceptions of statistical inference. Paper presented by Chris Wild at the launch of the UK 10-year statistical literacy campaign, World Statistics Day, Royal Statistical Society, London, 20 October 2010. www.rss.org.uk/main.asp?page=1321&event=1175
Pfannkuch, M. (2010). Laying foundations for inference. Mathematics Education Unit Seminar, University of Auckland, 1 October 2010
Pfannkuch, M. (2009). Building students’ inferential reasoning in statistics: Research in progress. Mathematics Education Unit Seminar at The University of Auckland, 28 August 2009.
Pfannkuch, M., & Wild, C. (2009). Building inferential reasoning in statistics. Keynote presentation at the National Numeracy Conference, Auckland, 16-19 February 2009. http://www.censusatschool.org.nz/2009/informal-inference/