Introduction and Background
This TLRI project is part of a larger programme of research referred to as the Data, Knowledge, Action project. The Data, Knowledge, Action programme of research focuses on the development and use of innovative and authentic data systems to help early childhood teachers in Aotearoa New Zealand examine young children’s curriculum experiences and strengthen their teaching practice. To date the programme comprises of: a) a pilot study undertaken in 2017 to develop and trial innovative and authentic data systems to investigate children’s experiences of curriculum; b) a 18-month project funded by the Teacher Led Innovation Fund (TLIF) involving teacher-led inquiries into children’s experiences (July 2018 – December 2019; and c) this Teaching and Learning Research Initiative (TLRI) funded project exploring sustained shared thinking to deepen young children’s learning (January 2019 – June 2021).
The broader research programme is focused on investigating data-informed teaching in early learning and understanding the capacities, skills and dispositions required to use authentic, observation-based data effectively. The research programme is a partnership among a multi-university research team and Ruahine Kindergarten Association. The research has been guided by the premise that effective data can lead to knowledge which can lead to action for improved teacher practice, curriculum implementation and positive learning outcomes (cf. Earl & Timperley, 2008; Gunmer & Mandinach, 2015).
This TLRI project extended on our previous work to undertake a deeper and more focused investigation of teachers’ engagement in sustained shared thinking in their interactions with children. Sustained shared thinking (SST) was selected as a focus area because it is a pedagogical strategy strongly associated with high-quality early childhood education (Meade et al., 2012; Siraj-Blatchford et al., 2002; Siraj-Blatchford, 2010) and is an area of pedagogy in which new data tools and systems could be further explored.
The TLRI research project was designed as two exploratory case studies using mixed methods data sources to address the research questions and to obtain descriptive and rich data about the experiences, opportunities, challenges and outcomes associated with SST. This report begins with an overview of data-informed teaching followed by a review of sustained shared thinking. The research questions are then described followed by the research methods, key findings, and conclusions from this research. We note this research occurred during the period in which COVID-19 closed Aotearoa New Zealand’s borders and we entered a nation-wide lockdown followed by periods of restricted alert levels. Due to the strong engagement of the teams and timing of inquiry cycles, we were able to proceed with our research with minor modifications to the original plan. Where applicable, these changes are described in this report.
Data-Informed Teaching
Helen Timperley’s work in Aotearoa New Zealand schools has long shown that the effective use of data can be a powerful driver of teaching and learning – with the power to transform and improve teaching practice and strengthen learner outcomes (Earl & Timperley, 2008; Timperley, 2010; Timperley & Robinson, 2001). McLaughlin et al. (2020) define data in education as “information relevant for learning and teaching collected through a known process for a known purpose” (p. 4). Data-informed teaching occurs when teachers use a range of sources of information to inform decisions about teaching and learning. These sources are gathered intentionally and include both formal (i.e., more structured) and informal (i.e., less structured) sources of information. In early learning, different forms and systems of observation are particularly well suited to gathering information in authentic settings for teachers and children (cf. Podmore, 2006).
While data has the potential to be a powerful driver of quality teaching and learning, it also has the potential to be mis-used or cause harm. It is critically important that data systems are designed with integrity and clarity, and that they are used for the purposes intended. Teachers and leaders should be aware of the ethical responsibility for ensuring positive outcomes from assessment and evaluation and guarding against unintended or harmful outcomes (Snow & Van Hemel, 2008). Moreover, teachers need the capabilities, mindsets, systems, and supports to effectively and appropriately use data to inform assessment and evaluation (Bocala & Boudett, 2015; Datnow & Hubbard, 2015, 2016). A key aspect of this project was to explore the supports needed that can equip teachers to use data effectively, appropriately, and in ways that empower both teachers and learners (and whānau).
Sustained Shared Thinking
The term “sustained shared thinking” (SST) was coined within the Effective Pedagogy in Preschool Education (EPPE) longitudinal study in the UK, in which the effects of preschool education on a range of cognitive and social outcomes for a national sample of 3000 children were examined. This study was followed up with intensive case studies of twelve settings which were associated with positive outcomes for children (the Researching Effective Pedagogy in the Early Years (REPEY) project; Siraj-Blatchford et al., 2002). The REPEY project identified SST as a key pedagogical feature of high-quality early childhood settings.
This early work defined SST as
an episode in which two or more individuals ‘work together’ in an intellectual way to solve a problem, clarify a concept, evaluate activities, extend a narrative etc. Both parties must contribute to the thinking and it must develop and extend thinking. (Siraj-Blatchford et al., 2002, 2003; Sylva et al., 2004)
The use of the term “thinking” in SST, as opposed to “language” was a deliberate choice intended to highlight the cognitive emphasis of SST interactions; however, the role of language and developing children’s language is viewed as equally important in SST (Siraj-Blatchford, 2009). SST involves both relational and intentional pedagogy and curricular content, taking place in the context of play-based and everyday interactions (Siraj-Blatchford, 2010). Further description explains that SST is most likely a one-to-one interaction (Siraj-Blatchford et al., 2002; Siraj-Blatchford, 2010; Meade et al., 2012; Sylva et al., 2004), usually between an adult and child (Siraj-Blatchford & Manni, 2008; Siraj-Blatchford, 2010) although also possible between peers (Siraj-Blatchford, 2010).
Meade et al. (2013), in examining effective pedagogy in Aotearoa New Zealand early childhood settings, defined it as “’extra talk’ beyond the level of instruction that deepens children’s thinking” (p.8) and stressed the reciprocity of SST interchanges. Previous research has shown low levels of SST in early childhood contexts (Meade et al., 2012; Siraj-Blatchford et al., 2002,2003) with SST making up only a small proportion of teacher-child interactions. The complexity of SST may make it difficult to use regularly and effectively in the context of busy early learning settings. Nonetheless, within the exploration strand of Te Whāriki, the importance of kaiako encouraging sustained shared thinking is specifically noted.
Research Questions
This TLRI project sought to use a range of data tools to identify the characteristics of SST and the frequency with which SST is used to promote children’s learning. We also sought to explore the potential of data-informed teaching to extend or increase the use of SST to enhance children’s learning. Because SST focuses on both thinking and language, the Te Whāriki strands of communication and exploration were initially selected as focus areas. However, as noted by Meade et al. (2012) and Siraj et al. (2015), children’s developing social-emotional capabilities can also be supported through SST. This became evident in our project, as a strong focus on the wellbeing, belonging, and contribution strands of learning also emerged as key areas of focus for the participating teams following the COVID-19 lockdown period. Our fourth research question was revised to show this expanded focus.
The research was guided by the following research questions:
- How are children experiencing periods of sustained shared thinking with teachers in our kindergartens?
- How might teachers make sense of and use data about the nature of sustained shared thinking between teachers and children?
- What changes occur in sustained shared thinking between teachers and children when using data-informed teaching?
- How do changes in sustained shared thinking between teachers and children promote children’s progress across the curriculum learning outcomes?
Research Methods
Research Design
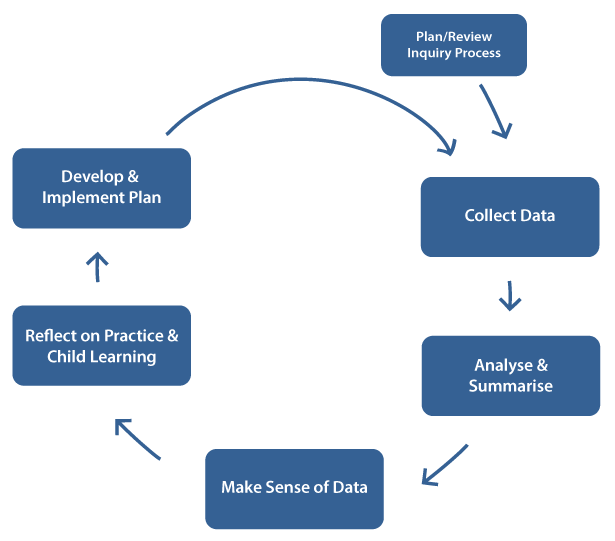
The study was conducted through exploratory case studies focusing on the experiences of teachers and children within two kindergarten settings. We employed a range of data collection and analysis tools to gather quantitative and qualitative research evidence. Each setting was supported to engage in successive cycles of data-focused inquiry (see Figure 1) using the planned data tools to examine SST. On-going inquiries were supported by the project teacher-researcher and critical friends. Throughout the inquiry cycles, we held a series of team and cross-team meetings with kindergarten teams to discuss and make sense of the data from their individual settings and form action plans for data-informed teaching.
In addition to the ongoing data collection conducted as part of the inquiry cycles, information about teachers’ perspectives of data and SST were gathered pre-post using focus groups and a project developed questionnaire. Details of data tools are described in the Data Collection and Analysis section below.
Figure 1. Data, Knowledge, Action Data-led Inquiry Cycle.
Partners and Settings
The project team involved four researchers, teachers from two kindergarten settings, a project teacher-researcher, and a project administration coordinator. The roles of the different team members are described below.
Teams from two kindergarten settings from Ruahine Kindergarten Association (RKA) participated in the research project: Linton and Makino Kindergartens. All team members participated in project activities. Team members ranged from experienced teachers to those newly qualified and with provisional teacher certification. Throughout the project, teams received support from RKA Senior Teachers.
The teacher-researcher in the present project was an RKA-nominated teacher who was part of the development and trialling of the project-selected data tools in the original pilot study and led the TLIF project. The teacher-researcher was an experienced teacher and had explicit training and experience in the development and adaptation of data collection tools, data analysis, data interpretation, and providing data supports. The project administration coordinator provided administrative support for project activities, including scheduling and meeting arrangements, and also undertook some research assistant work, including project data entry and analysis. Each of the four researchers had knowledge and experience with SST and data systems but took different roles in the project. Two of the researchers provided ongoing and direct support to the kindergarten teams during their inquiries (referred to as critical friends) and two of the researchers were not directly involved in supporting the teams during the inquiries (referred to as external partners).
Data Collection and Analysis
The project used multiple data sources, both within the inquiry cycles for teams to support data-informed teaching and for analysis of research outcomes. The data tools focused on gathering information about children’s learning experiences and teachers’ use of the teaching practices that support children’s learning, including an explicit focus on teaching and learning related to SST. Table 1 outlines those data tools used within data-focused inquiries. Data tools were used in selective and integrated ways to gather and incorporate new information with teachers’ existing knowledge gained from ongoing assessment information collected in the setting.
| Data System | Collection Details: | Focused on: | Presented as: | Purpose: |
|---|---|---|---|---|
| Child Information Profile (CIP)* McLaughlin, Hunt, Cherrington, Aspden, & McLachlan, (2018). |
• Set of paper forms with structured prompts and questions to support team discussion• Teams select specific profiles across children or all profiles for a few children |
Key aspects of child learning:
• Social-emotional • Language and communication • Learning dispositions • Interests and preferences. |
• Team discussion | • Identifies aspects of child learning teams want to know more about • Supports shared team understanding |
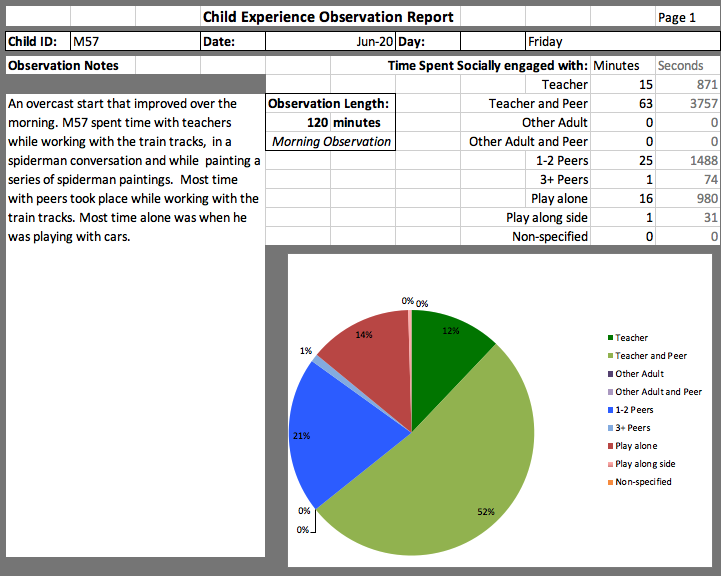
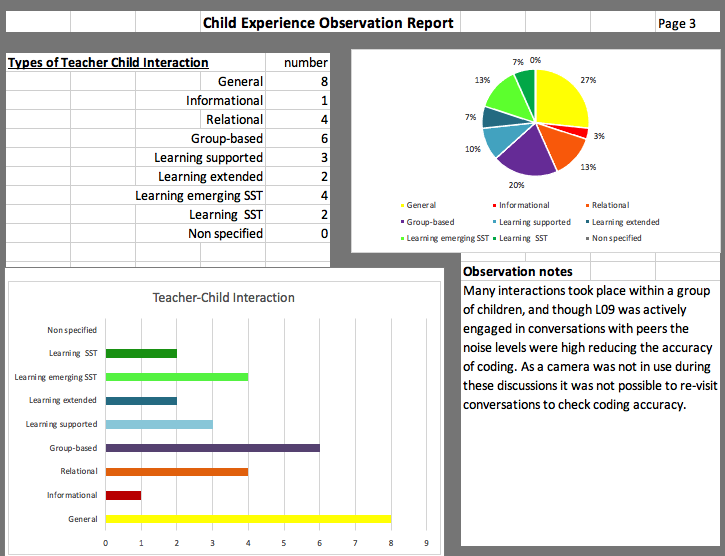
| Child Experience Observation System (CEOS)* McLaughlin, Hunt, Cherrington, Aspden, & McLachlan, (2018). |
• 2-hour live observation recorded on tablet.
• Collected by teacher-researcher (w/ Mooses observational |
Duration & event codes for:
• Where children go (indoor/outdoor) • Who they play with (teachers, peers, etc) • Types of activities (free play, small group, etc) • Teacher-child interactions (informational, relational, learning focused, SST, etc) |
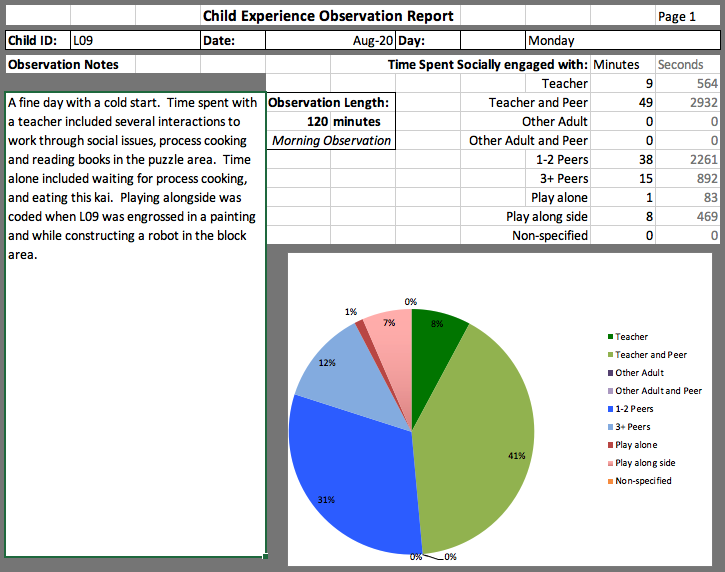
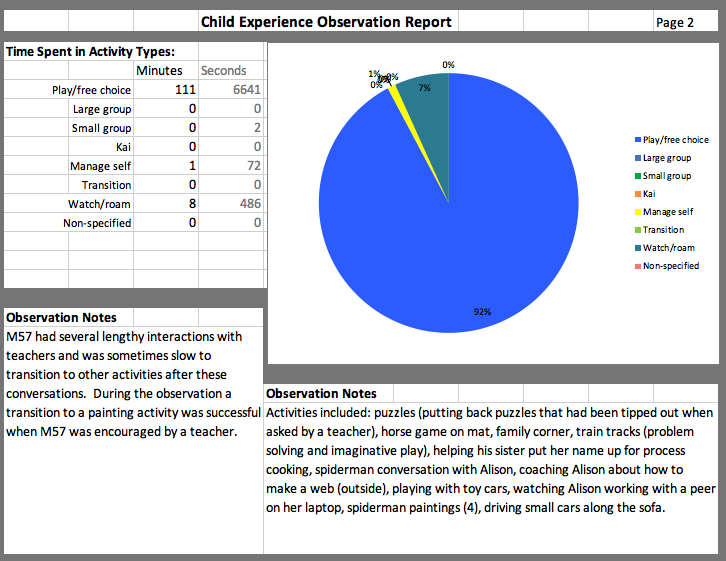
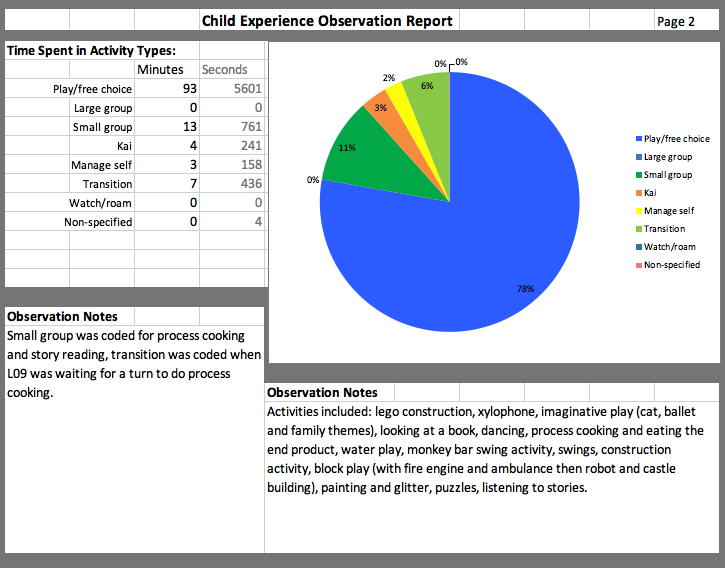
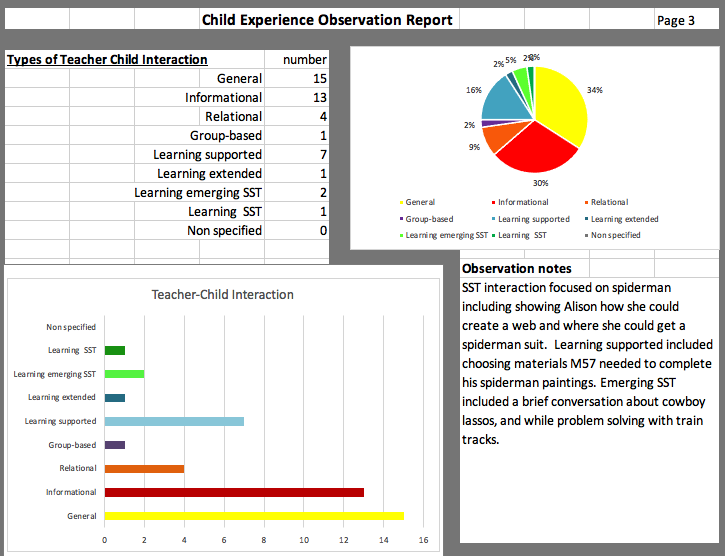
• Graphed data reports (pie charts and bar graphs) with observation notes
• Team discussion |
• Shows key aspects of children’s engagement
• Can be used to identify trends and patterns in engagement across children |
| Play & Learning Analysis (PLAS)* McLaughlin, Cherrington, McLachlan, Aspden, & Hunt, (2018). |
• 1-hour video using camera child or teacher is wearing
• Select video clips identified based on team focus |
Select clips might highlight:
• Child learning • Teacher-child interactions • Teaching practices |
• Review selected video clips
• Team discussion • Guiding question and facilitated ‘arrow analysis’ |
• Shows children’s learning and self-talk when adults not nearby
• Shows aspects of interactions not noticed in the moment • Supports in-depth focus and reflection on practice |
| Language Environment Analysis (LENA) System** LENA Foundation (nd) |
• Up to 8 hours of audio recorded from small recording device (LENA DLP) child wears.
• Teacher-researcher connects LENA DLP to computer to transfer data for analysis. |
Data on specific aspects of children’s communication and language environment:
• Adult words spoken to key child. • Adult-child conversational turns. • Child vocalisations. • Make-up of language environment. |
• Graphed data reports (bar graphs)
• Team discussion |
• Provides information on quantity of language interactions |
| Early Childhood Environment Rating Scale Curricular Extension (ECERS-E) Sylva, Siraj-Blatchford, & Taggart (2010) |
• 3 to 4-hour live observation collected by 2 trained observers.
• Observation tool guidelines & scoring implemented. |
Environmental and curricular practice related to:
• Literacy • Maths • Science • Diversity |
• Graphed data (bar graphs)
• Written observation notes • Team discussion |
• Provides feedback on teaching practice to support reflection
• Highlights teaching practices observed and not observed |
| Sustained Shared Thinking & Emotional Well-being Scale (SSTEW)** Siraj, Kingston, & Melhuish (2015) |
• 3 to 4-hour live observation collected by 2 trained observers.
• Observation tool guidelines & scoring implemented. |
Sustained shared thinking practice related to:• Building trust, confidence, & independence• Social & emotional well-being• Supporting & extending language & communication• Supporting learning & critical thinking• Assessing learning & language |
• Graphed data (bar graphs)
• Written observation notes • Team discussion |
• Provides feedback on teaching practice to support reflection
• Highlights teaching practices observed and not observed |
Note. References listed are the manuals, protocols, and instruments for each data tool.
*Project developed tool
**For purchase tool
Ongoing data collection of the CEOS, PLAS, and LENA data was undertaken by the project teacher-researcher. Teams received data from CEOS and access to PLAS video on a weekly basis during inquiry phases. Two example CEOS observation reports are shown in Appendix 1. Teams completed the CIP and reviewed video from the PLAS throughout the inquiry cycles. Data collection of the SSTEW and ECERS-E was conducted by the critical friends, both trained observers in the use of these tools for research purposes. For researcher purposes, video clips used for the PLAS were also dual-purposed for a secondary analysis of selected clips. These video clips were analysed for key features including the overall duration, number and type of learning foci that occurred during the interaction, and the reasons these teacher-child interactions began or ended.
In addition to the above data collection tools, data meeting minutes were used by the critical friends to record teachers’ experiences over time; focus group data was collected by the project external partners pre- and post; and the data-informed teaching questionnaire was sent to the teachers for completion prior to their focus groups. Table 2 outlines additional detail about these sources of information.
| Source | What? | When? | Who? |
|---|---|---|---|
| Joint team meetings | Teachers from both teams coming together to learn about the project, share their experiences as the inquiries evolved and celebrate achievements. Reflections were recorded in meeting minutes. | At the beginning, middle and end of the project |
Both teams, the teacher-researcher, and critical friends |
| Data team meetings | Team meetings focused on reviewing specific data sources with support, selection of focus areas, development of action plans, and planning for further data collection. Reflections were recorded in meeting minutes. | Ongoing and, at least, twice a term. | Each team, the teacher-researcher, and critical friends |
| Focus Groups | Semi-structured group interview protocol to gather information about teachers’ perspectives of SST, data, and their experiences in the project. Focus group data were recorded, transcribed, and analysed by the external partners to identify key themes across the kindergarten settings. | At the beginning and end of the project | Each team, separately meeting with an external partner |
| Data-informed teaching questionnaire | A project-designed measure for teachers to rate their level of data confidence on 36 data-use statements aligned with the key components of the data-led inquiry cycle. | At the beginning and end of the project | Individual teachers from each team |
Data-led Inquiries
Data-led inquiry cycles were undertaken with each kindergarten team between July 2019 – December 2020. The inquiry cycles followed the processes shown in Figure 1 above. The inquiry cycles utilised data from the SSTEW and ECERS-E rating scale observations as initial prompts for teams to determine a practice focus for their inquiry phases. See Appendix 2 for the focus areas teams selected for each inquiry. Within each phase, the teacher-researcher used the CEOS observation schedule for live tablet-based observations, together with a GoPro camera worn by children or teachers to collect clips for the PLAS and a LENA recording device worn by focus children, to collect data in each kindergarten. A midpoint SSTEW observation provided teams with feedback on shifts in practice. Teacher and child data were regularly reviewed by each team, supported by the teacher-researcher and critical friends, as they developed, implemented, and evaluated their planning to address their inquiry foci. The focus of data reviews were intentionally staggered to support effective data use and avoid data overload. A final round of SSTEW and ECERS-E observations were undertaken and shared with each team to provide a wrap-up to their inquiries.
Ethics
Research ethics approval was gained from Massey University Human Ethics review panel and the research was conducted in accordance with the Massey University Code of Ethical Conduct for Research, Teaching and Evaluations Involving Human Participants.
Key Findings
This section outlines the key findings for each research question, drawing on several data sources for each question. Additional information about data sources are provided when necessary to further contextualise the findings. Findings are presented across kindergartens except when there are notable differences between the kindergartens, due to their different foci for the inquiries.
RQ 1: How are children experiencing periods of SST with teachers in our kindergartens?
Data from the CEOS, LENA, and secondary video analysis process provide insights into how children are experiencing periods of SST with teachers in the kindergarten settings. In addition to our focus on SST, we identified a different type of teacher-child interaction beneficial to children’s learning, which we have referred to as Positive Learning Interactions (PLI) (defined below). Both SST and PLI are described in the overall insights below.
Overall insights:
- Children spent a large majority of their time in free play with their peers and teachers.
- SST and PLI occur less frequently than other interaction types.
- Children’s individual experiences of play and SST or PLI with peers and teachers were varied.
- The amount of time a child spent with a teacher was positively correlated with the number of SST or PLI episodes a child experienced.
- Teacher-child interactions that are described as SST and PLI were differentiated by the duration and quantity of learning foci embedded within the interaction.
- There were a range of positive and promising reasons influencing why SST or PLI episodes began or came to an end.
- The teacher-child talk environment was variable for individual children and affected by many factors.
In the content of our project, we used the following definitions of SST and PLI:
Sustained Shared Thinking (SST) was defined as the child involved in an in-depth sustained interaction in which both teacher and child contributed ideas and worked together in an extended way to advance the child’s thinking and learning. This may have been evident in the high level of engagement of the child and teacher. Across the interaction, teachers drew on a range of interaction strategies to support the child’s thinking and learning in a conceptually deep and extended way. The interaction has flow that engages both parties in a meaningful way.
A Positive Learning Interaction (PLI) was defined as the child involved in an entry level interaction in which both teacher and child contributed actions or ideas to extend the child’s thinking and learning (intent is active and focused on positive learning which may come to fruition or not). Teachers use interaction strategies throughout. Different types of PLI were identified:
-
- Extended and surface – The interaction may be limited by child’s responses or the teacher’s actions (surface level) but occur for several exchanges in a back-and-forth way.
- Deep and brief – The interaction might involve conceptually deeper child responses or teacher actions, but these were brief and did not extend beyond one or two exchanges.
- Child language/ engagement/ confidence limited – The interaction might occur when a teacher’s action elicited a limited child response (this may be due the child’s language abilities, current distractions, or confidence). The teacher may engage in language modelling to support extension or attempt to follow-up.
- Mismatch – This interaction occurred when a mismatch or confusion in communication or interaction occurs during a back-forth learning-focused exchange that limits or ends the interaction (e.g., teacher does not hear or understand the child’s response and moves on).
- Mixed group participation – The interaction occurs when the teacher is intermixing interactions across a small group of children as long as the interaction for the target child is ongoing without extended delays between opportunities for interaction.
While Positive Learning Interactions (PLI) were not as comprehensive as SST interactions, they were identified as having a meaningful impact on children’s learning. Teachers were observed sequencing these types of interactions together over the day such that the combination of these interactions may be similar to an SST, albeit more spaced across time.
Children at play with their peers and teachers
Data from the CEOS, showed that on average, children spent most of the observation time in free play. Table 3 shows the mean duration across observations by phase. This high percentage reflects several factors evident over the 2-hour observations. The timing of the morning observation and the flexibility of session routines was a key feature. Data in Table 3 also shows that for most of the observations, children played with 1-2 peers followed by spending time with a teacher and peer. Based on the percentages, individual children had, on average, less than 10 minutes with a teacher in one-to-one interaction during the 2-hour observation.
SST and PLI occur less frequently
CEOS data further showed that the majority of teacher–child interactions were of a general nature or informational, with fewer interactions focused on skills or knowledge or classified as PLI or SST. These findings are consistent with the international and national literature. It is important to note that, while SST or PLI occur less frequently, these interactions are longer in duration and complexity than other interaction types. For example, a general or informational teacher–child interaction might range from a few seconds to a minute, such as a brief hello or a reminder about kindergarten expectations. In contrast, PLI or SST occurred across several minutes and offered opportunities for more depth of learning. Thus, while the occurrence is
less frequent, the engagement extends for a longer duration when these interactions do occur.
| Means across all cases (all observations, across kindergartens by phases) |
|||
| Duration codes presented as percent of time (%) | Phase 1 (N=14) |
Phase 2 (N=9) |
Phase 3 (N=11) |
| Nature of Activity Engaged In | |||
| Free Play | 87% | 74% | 80% |
| Large Group | 2% | 9% | 3% |
| Small Group | 0% | 0% | 0% |
| Kai | 6% | 5% | 7% |
| Manage self | 3% | 4% | 3% |
| Transition | 1% | 2% | 1% |
| Roam | 1% | 1% | 0% |
| Non-Specified | 0% | 2% | 1% |
| Who Child is Engaged With | |||
| Teacher | 8% | 8% | 4% |
| Teacher and Peer | 29% | 28% | 19% |
| Other Adult | 2% | 0% | 0% |
| Other Adult and Peer | 4% | 0% | 1% |
| 1-2 Peers | 35% | 37% | 44% |
| 3 or more Peers | 10% | 8% | 7% |
| Playing Alone | 9% | 10% | 11% |
| Playing Alongside | 3% | 4% | 8% |
| Frequency codes presented as number of occurrences | |||
| Nature of teacher-child interactions | |||
| General | 15 | 9 | 11 |
| Informational | 5 | 8 | 5 |
| Relational | 1 | 2 | 3 |
| Group | 1 | 2 | 1 |
| Skills focused | 6 | 3 | 2 |
| Knowledge focused | 4 | 1 | 1 |
| Positive learning interaction (PLI) | 3 | 3 | 1 |
| Sustained Shared Thinking (SST) | <1 | 1 | <1 |
| Total Number of Teacher-Child interactions | 35 | 27 | 24 |
Note. Data summarised across 2-hour observations. In phase 1 Makino and Linton each had 7 observations. In both Phase 2 and 3 Makino had one more observation than Linton due to scheduling. Operational definitions for each coding category are available upon request. Frequency sums may be higher than total due to rounding.
Variability across children
While the data presented in Table 3 show the average trends, it is important to note that there was significant variability across children. For example, some children spent less than 5% of their time with a teacher or teacher and peer, while other children spent up to 65% of their time with a teacher or teacher and peer. Moreover, some children had up to 12 PLI and up to 3 SST interactions during their 2-hour observation, while other children had no PLI or SST interactions. Teaching teams found the specific child information as well as looking at trends across children useful for informing practice. There were a variety of child and contextual reasons why children had such diverse experiences in the context of everyday activities and play. Rather than viewing this diversity of experience as problematic per se, it is important teams have information about children’s experiences so they can notice when, for example, children are not regularly interacting with teachers or are spending all their time with teachers and limited time with peers.
Time with a teacher was positively correlated with more SST or PLI
To understand the relationship between the amount of time a child spent with a teacher (or teacher and peer) and the type of learning interactions that occurred, we correlated the total amount of time with teacher (including teacher only and teacher and peer) with the number of PLI and SST interactions that children experienced using Pearson’s R correlations. A child’s time with a teacher was positively correlated with PLI (r = .59) and SST (r = .50), both positive and strong correlations. While this finding might seem intuitive, it is an important one to point out, given many ECE teachers view their roles as observers or monitors of children’s self-directed learning during free play rather than active and engaged agents in which they are contributing to and extending on children’s learning. Thus, for these positive and important learning interactions (PLI and SST) to occur, teachers must spend time engaged with children.
SST and PLI occurs across curriculum focuses
Selected video clips that contained a PLI or SST interaction between a teacher and child (or teacher and small group of children) were analysed to understand the nature of the learning foci being embedded into the SST or PLI episodes. Table 4 presents the different foci by kindergartens. The differential patterns observed correspond with the specific inquiry foci that teams selected. For example, Linton focused on social-emotional wellbeing and being able to solve social problems while Makino had a focus on imagination and discovery.
| Curricular learning focuses | Percentage of Episodes (%) | |
|---|---|---|
| Linton (N=23) |
Makino (N=17) |
|
| Social-emotional wellbeing | 17% | 0% |
| Communication and language development | 26% | 24% |
| Funds of knowledge / interests & passions / connections to home, family, and culture | 30% | 41% |
| Concept development | 52% | 65% |
| Directing and appreciating their own learning | 43% | 24% |
| Recognising patterns | 13% | 18% |
| Higher order thinking, investigation and exploration (processes of thinking) | 65% | 76% |
| Creativity, imagination and humour | 0 | 35% |
Note. Data from 40 selected clips from the GoPro video across inquiry phases. Each interaction could be coded with as many foci as relevant, thus percentages will not sum to 100. Operational definitions for codes are available upon request.
In addition to the range of learning foci, we examined the number of foci and duration of our selected video clips by PLI and SST. As seen in Table 5, interactions classified as SST were longer in duration and included more learning foci embedded within them. These data support the depth of learning that may be available in these extended interactions, while also showing that combining several PLI over the course of the day may also result in similar learning opportunities.
| Mean | Range | |
| Number of learning focuses | ||
| PLI | 2.1 | 1-4 |
| SST | 3.2 | 1-5 |
| Duration of video clips | ||
| PLI | 3 min | 1-8 mins |
| SST | 7 min | 3-18 mins |
Note. Data from 40 selected clips from the GoPro video.
How PLI or SST interactions began
In order to understand what contributed to the emergence of a PLI or SST interaction, the 40 selected video clips were further analysed. Across both teams, the spontaneous extension of an interaction or a planned child extension for a specific child were the primary reasons why a PLI or SST interaction began, as shown in Table 6. The Linton team had several interactions that emerged from a planned team focus while Makino team had several interactions that occurred in response to the set-up of a curriculum experience. Data from these observations shows that PLI or SST interactions can occur both as a result of planning and from teachers being alert to spontaneous opportunities to engage in extended interactions.
| Prompts |
Percentage of Episodes (%) | |
|---|---|---|
| Linton (N=23) |
Makino (N=17) |
|
| Spontaneous extension | 30% | 41% |
| Planned child extension | 43% | 29% |
| Planned team focus | 22% | 0% |
| Curriculum experience set up | 4% | 29% |
| other | 0% | 0% |
Note. Data from 40 selected clips from the GoPro video. Each interaction was coded with one of the possible coding categories. Operational definitions for codes are available upon request. Percentages may not sum to 100 due to rounding.
How PLI and SST interactions came to an end
The reasons a PLI or SST interaction ended are shown in Table 7. Natural flow was the most prominent reason (78%) an interaction ended with only a few occurrences of the child or adult shifting their attention. Session routines were not an observed reason although teacher routine did result in two interactions coming to an end. An important factor supporting the natural end of SST and PLI was a high level of team awareness and support within the team. Teachers often stepped in to attend to children who needed help when a colleague was engaged in an SST or PLI. This support enabled the teacher to continue with their interaction until it came to a natural end.
| Reason for end | Percent of Total |
|---|---|
| Natural Flow | 78% |
| Child Shift | 10% |
| Adult Shift – child | 8% |
| Adult Shift – adult | 0% |
| Session Routine | 0% |
| Teacher Routine | 0% |
| Non-specified | 5% |
Note. Data from 40 selected clips from the GoPro video. Each interaction was coded with one of the possible coding categories. Operational definitions for codes are available upon request. Percentages may not sum to 100 due to rounding.
During the CEOS observations, the teacher-researcher frequently noted ideas from earlier PLI or SST interactions being re-visited. This often happened later in the same session, and sometimes on subsequent days, usually with the child initially involved and at times encompassing a wider group of children. In these occurrences, we can think of the ending of the earlier interaction as a temporary pause before the interaction is returned to and revisited. Though data were not gathered to measure the frequency these interactions were re-visited, it was clear from the teacher-researcher’s observation reflections that teachers used SST and PLI as a springboard to plan and implement further interactions designed to extend ideas, interests and learning at a later point in time. Again, this suggests the features of a full SST interaction might occur across several connected but separate PLI through the returning to and revisiting of a previously explored idea.
Teacher-child talk environment
The Language Environmental Analysis (LENA) Pro System was used to provide information on the teacher-child talk environment. Table 8 shows the mean across recordings for meaningful audio was 39%, with a standard deviation of 8. There was a slightly higher recording of overlap audio, with a mean of 41% and standard deviation of 11. This is not a surprising finding, given that the recordings were undertaken in kindergartens, in either the inside or outside play spaces, presenting a more challenging audio recording environment than the home environment which this system was originally designed for. Notably, electronic noise only constitutes 1% of the sound recorded.
Table 8 also reports the mean rate of adult words spoken per hour, the number of child utterances per hour and the number of conversational turns per hour. Notably, the standard deviation and range across children is significant suggesting there was not a uniform language experience for children in this study. The various language experiences of children may be influenced by a range of child, teacher, and setting factors.
|
LENA Recordings
(N=57 audio recordings, across kindergartens and phases) |
|||
| Audio environment: (% of recording) |
Mean | STD | RANGE |
| Meaningful | 39% | 8 | 27 – 52 |
| Overlap | 41% | 11 | 21 – 61 |
| Distance | 7% | 3 | 3 – 13 |
| Electronic noise | 1% | 2 | 0 – 11 |
| Noise | 2% | 1 | 0 – 4 |
| Silence | 8% | 4 | 3 – 22 |
| Teacher-child interaction: (# /rate per hour RHP) |
|||
| Adult word count RPH | 970 | 348 | 1,165 – 6,067 |
| Conversation turns RPH | 41 | 20 | 47 – 279 |
| Child vocalisations RPH | 331 | 132 | 262 – 1692 |
Note. Recordings that were less than 3 hours and with less than 27% meaningful audio were removed prior to analysis. Because the audio recordings were different lengths of time, data were transformed to represent a rate per hour for each LENA interaction variable.
It is important to note the nature of these data only quantify the exchanges occurring between teachers-children and children and peers. The quality of these interactions is not known from the LENA data and assumptions that more is better should be avoided. Nonetheless, the data are promising – teachers were talking to children and there were many opportunities for conversational turns or ‘serve and return’ interactions.
RQ 1 summary
Our research sought to explore how children are experiencing periods of SST with teachers in our participating kindergartens. Our project found overall low rates of SST, however, these were supplemented by the addition of PLI as a notable learning interaction. Data reveal that the amount of time spent with children is a key feature of being able to extend teacher-child interactions into more learning-focused opportunities. Moreover, when teachers have a focus and support each other to engage in extended interactions, PLI or SST are more likely to occur. Our project data reinforce the importance of teachers spending time with children and intentionally planning for their focused attention in shared learning interactions, in which both teacher and child are contributing to the learning. While the data provide useful insights into the characteristics of SST and PLI and the extent to which they occurred in these settings, it is important to keep in mind that our data represent a small sampling of the total interactions that occurred each day in these settings. Further research about the quality and quantity of teacher-child interactions within ECE settings is warranted.
RQ 2: How might teachers make sense of and use data about the nature of sustained shared thinking between teachers and children?
Data from the Data Meeting Minutes, Focus Groups and the Data Informed Teaching Questionnaire provide insights into how teachers made sense of and used data about the nature of sustained shared thinking between teachers and children.
Overall insights:
- Teacher confidence with data changed over time and teachers reported using data had been a positive and valuable experience.
- Data was used to both affirm and challenge teachers’ thinking about practice and children’s learning. Multiple data sources supported teams to build a comprehensive picture about a child and enhance intentional pedagogy.
- Specific and facilitated data use activities changed over the course of the project, both in their complexity and in teachers’ ability to use data with greater independence.
Changes in teachers’ confidence with data
Initially, many teachers did not see themselves as ‘data users’ and reported low levels of confidence with specific data use skills and/or were a little nervous about their involvement in the project. Teacher confidence with data use and how data might inform their understanding changed over the project. By the end of the project, teams reported that this had been a positive and valuable experience, that they had gained a great deal of information about their own practice, SST, and children’s learning, and that they felt confident in data use.
Figure 2 below shows changes in teachers’ confidence ratings on key data-use skills organised around 5 key areas of the data-led inquiry cycle. Data shown in the table are the average ratings across teachers for all items in each key area. As seen in the figure, teachers made gains in all areas with the greatest gains in collecting, analysing, making sense of data, and reflecting on practice and child learning.
Figure 2. Pre-Post Data-Informed Teaching Ratings
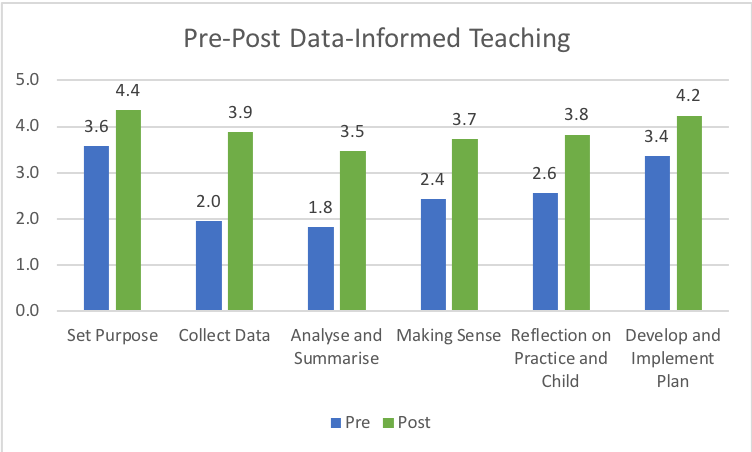
Note. Data from the project developed data-informed teaching questionnaire. Teachers rated their level of confidence from 1 = not confident through 5 = very confident.
Findings about changes in teachers’ confidence were further supported and understood using the focus group data. One of the important findings from the pre-project focus groups was that teachers in both kindergartens did not consider they had sufficient preparation for using data in their teaching in their initial teacher education or in-service professional learning, apart from learning some observation techniques, including running records. Teachers discussed their current approaches to collecting data with children, which included the use of notebooks and video, writing learning stories for individuals and groups, and talking with families, but commented that use of specific approaches beyond learning stories were mainly used for children for whom they had concerns about learning and development.
Teachers in both kindergartens expressed excitement about being part of the project, although they also expressed some nervousness about seeing themselves on camera, about being involved in research processes, and a generalised concern about the workload involved. However, teachers in both kindergartens also expressed excitement at the opportunity to learn more about the children in their kindergartens, to learn how to use new tools to support them to reflect on their teaching, and to find out what children are saying when teachers were not present.
Teams described a significant shift in their feeling about data.
Yeah, I think we think of data and making it measurable, and you think of those words and statistics and comparing, it was a bit scary at the beginning. And thinking, oh are we really going to be going down that track comparing numbers sort of thing, but really now I can see how much more meaningful and useful it is. It’s a great way of showing progress, isn’t it, and change, and a way to evaluate teaching and whether you’re on the right track or what you can change. I’m super way more confident now than I was. (Linton Post FG)
Multiple data sources were used to enhance intentional pedagogy
Data was used to both affirm aspects of practice and children’s learning but, more importantly, also challenge teachers’ assumptions about their practice and knowledge of children’s learning that strengthened their understandings of children’s capabilities and ways to support them. Multiple data sources (each providing unique sets of information) supported teams to build a more comprehensive picture about a child’s learning and experiences when combined with their existing knowledge and understandings gained in partnership with families and whānau. In turn, this supported teams to enhance their intentionality in planning, teaching, and assessment.
Arguably, a key finding across both kindergartens that set the conditions for teacher learning was that teachers discovered they did not know as much about children as they thought they did before they used the range of data tools involved in this project. Teachers also commented that discrepant data had made them reflect more deeply on their perceptions of children’s learning needs. The teachers identified that the data gave them greater insights into children. When asked what the most significant learning in the project one teacher responded:
For me, it’s knowing that it’s okay actually not to know everything about every child, you can’t, we don’t know everything, but there are tools we can use to support us to find out that information. (Linton Post FG)
Teachers stated that they had changed their understandings of what constituted SST. Teachers used this new knowledge of SST and their new knowledge about children to inform how they might use intentional teaching strategies to support SST between teachers and children.
I think I have an understanding of it now whereas previously I would not have confidently said that I had an understanding of what that A) was and B) looked like in a positive learning environment. I guess [its] my interpretation but that ability to be able to gauge where the child’s knowledge is currently, how their approach to learning fits with the context you’re working within and how you can use the teaching strategies you have to provoke that next level thinking and that really positive processing and problem solving to and from teacher and child to continue building on. (Makino Post FG)
Increased knowledge about SST and children also resulted in teams’ planning for and creating increased opportunities for SST.
We’re actually planning for those shared sustained opportunities to occur…it’s more intentional. Whereas before some of those shared sustained opportunities might have been more emergent. So, I’d say there’s definitely, not to say there aren’t still those teachable moments where that does occur, but there’s definitely more planned. (Linton Post FG)
Teachers described a significant shift in their willingness and ability to use a range of data sources.
I think being open to using a range of tools, once you get over that initial what’s this about, you know it’s been really good to have those there – to be able to look back on your teaching practice, and be able to reflect on what it is that you’re doing. It’s always scary stepping out of your comfort zone but at the end of the day it’s about what we can provide for the children so why not. (Makino Post FG)
Specific and facilitated data use activities changed over the course of the project
Data review meetings were designed to support teams to engage with the different sources of data, make sense of and use these data to plan for children’s learning and their own teaching practice. The critical friends and the teacher-researcher used a variety of data support facilitation techniques and scaffolded and faded their support over time. Feedback from teams identified two techniques that stood out as particularly useful in this project: ‘data walks’ with CEOS data and ‘video (arrow) analysis’ with GoPro Video data. Examples of each and how teams used these techniques are illustrated below.
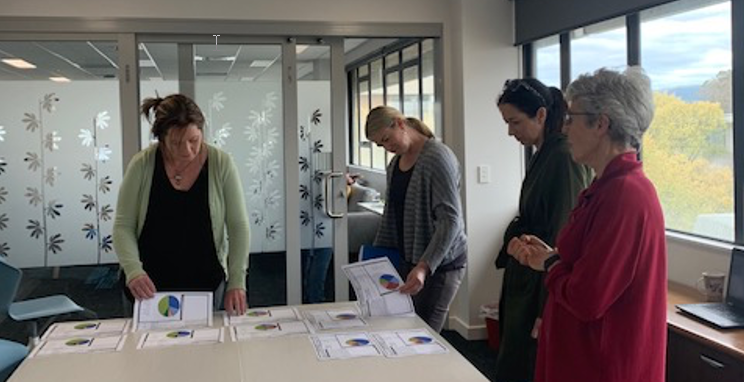
Data walks involved laying out child-specific CEOS data reports across several different children and looking for trends and patterns. This was typically done around a table so the team could stand and walk around the table as they looked at data for different areas across children. The intent was not to compare children but to look for trends or discrepancies in what teams might expect. Data walks were useful for highlighting both affirming and discrepant data on what teachers thought children were experiencing.
Picture 1 below shows a data review meeting toward the end of the project by which time the Linton team was very confident in their use of data and engaged in a data walk to make sense of the trends they were seeing, what it might mean and what they might do in their planning.
Picture 1. Linton team engaged in independent data walk in October 2020.
These feelings of confidence were also reflected by the team at the end of project focus group.
And the fact that we could actually understand what the data was telling us by that point, whereas at the beginning with our first data walk we were looking at Tara like what, what’s she talking about. It’s like an alien language wasn’t it at first. (Linton Post FG)
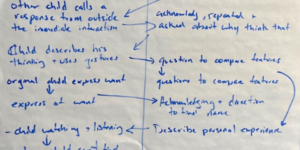
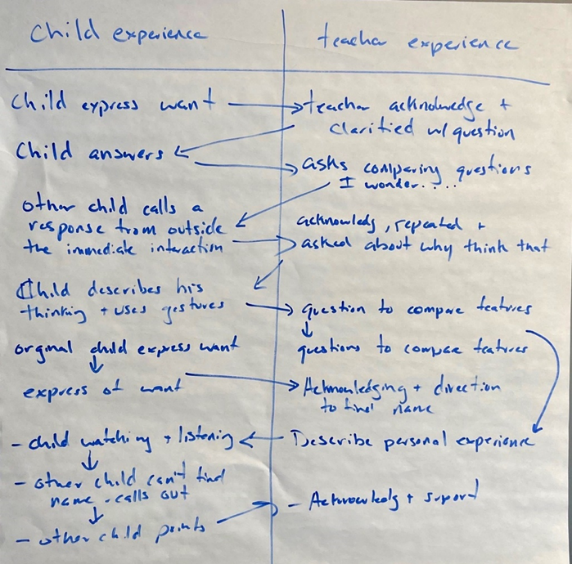
Video (arrow) analysis involved watching short clips of video collected with the GoPro and analysing the video to understand the nature of the teacher-child interactions. Early facilitation techniques of video analysis often focused on looking closely at the child’s learning experience OR looking closely at the teaching strategies used by the teacher to support learning while later analyses focused on both teacher and child actions using a technique we called arrow analysis. The arrow analysis was designed to support teams in examining their moment-by-moment interactions with a child (or children). Short video clips of teacher-child interactions were reviewed and then charted (using stop, start, and replay as needed) on large sheets of paper. As the video was watched, teams were identifying what was happening during the conversation, using arrows to show the flow of the interaction and the back-and-forth nature of interactions between children and teachers. The technique focused on the subtleties of how children initiated interactions with, and responded, to the teacher along with the strategies used by teachers to maintain or extend the interaction. This exercise was valuable in raising teachers’ awareness of the wide range of teaching strategies and actions that support SST interactions, and in emphasising their shifting use of different strategies within a single episode.
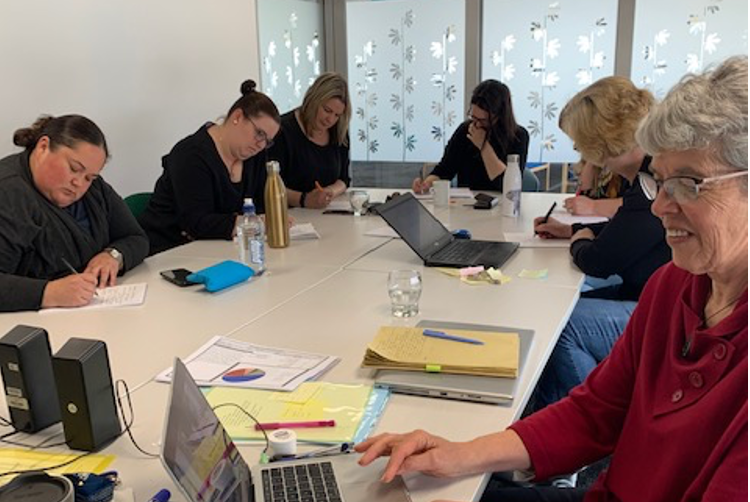
Picture 2 below shows a data review meeting toward the end of the project by which time the Makino team was very confident in their use of data and using the video clips for analysis. In the picture, the team has just finished watching a clip and are recording their observations for discussion. Picture 3 shows an example arrow analysis recorded on the large poster paper.
Picture 2. Makino team engaged in arrow analysis in October 2020.
Picture 3. Example arrow analysis
In the focus group, the Makino team discussed the different ways that team members felt about the use of video and the initial hesitations that some had. They then reflected on the value of the video and how their feelings about the use of video changed over time.
Initially it was very frightening with the GoPro on us. You know it’s all very well doing it with the children but when it’s actually us and you’re aware that you’re being recorded and to try and stay true to your natural style of teaching. I had to just get over myself and get on with it.
For me, I think watching the video clips from the children first before we wore the GoPro was good too because it got us a little bit used to watching myself and used to my voice and then seeing how much we learnt about them from watching those clips and how much we had to learn about ourselves.
You’ve got your mindset past what I sound like and that and actually what was happening, you kind of forget all about that and it’s just exciting to kind of see what comes of it.
Yeah, the value that came from those videos and I thought, oh that could actually be for me too.
And interesting because sometimes what you think was happening was not happening.
I think too, as we unpacked those clips of the children and we learnt more about all of the teaching strategies we were using, without that I wouldn’t stop and think about it.
And then thinking about that actually it’s just about the children; it’s about your teaching and the children, so what I think of myself being on camera doesn’t really matter. (Makino Post FG)
RQ 2 Summary
Our research sought to explore how teachers make sense of and use data about the nature of SST between teachers and children. Findings suggest that teachers needed support to overcome early hesitations about using data and the role that different types of data could offer. The use of multiple sources and a range of facilitation techniques offered something that was useful for everyone. Early data review meetings focused on developing teachers’ broad understandings of individual data sources. By the end of the project teams were adapting data systems for their own use and were engaged in sophisticated and layered analyses of multiple sources of data independently. Consistent with the literature on data use, having access to discrepant data (i.e., information that is different to what teachers currently think) and access to data that provided new information about children was important and was used to inform planning, teaching, and further assessment. While not specifically highlighted through the data shared here, teachers’ intentional use of the new information gained was regularly done in collaboration with families and whānau.
RQ 3: What changes occur in sustained shared thinking between teachers and children when using data-informed teaching?
Data from the SSTEW and ECERS-E observations were used to examine changes that occurred in SST between teachers and children (when using data-informed teaching). Overall insights from the use of these tools suggested that:
- Teachers and teams made notable changes in their use of practices that support SST over the course of the project.
- Having access to graphed data and specific information about practices supported team motivation and implementation.
Changes in teachers’ use of SST and supporting practices
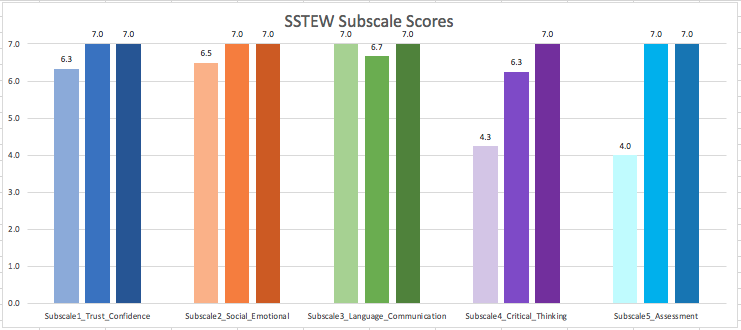
The Sustained Shared Thinking and Emotional Well-being Scale (SSTEW; Siraj, Kingston, & Melhuish, 2015) is an observational rating scale used to examine the extent to which early childhood teams are engaged in teaching actions that support children’s SST. The SSTEW has 5 subscales which are scored on scale of 1 to 7 with scores of 2/3 representing adequate practice, 4/5 representing good practice, and 6/7 excellent practice. The subscales are:
- Sub-Scale 1: Building trust, confidence and independence (items 1-3)
- Sub-Scale 2: Social and emotional well-being (item 4+8)
- Sub-Scale 3: Supporting and extending language and communication (items 5-7)
- Sub-Scale 4: Supporting learning and critical thinking (items 9-12)
- Sub-Scale 5: Assessing learning and language (items 13-14)
As seen in Figures 3 and 4, each team began with areas of strength and areas of practice to grow. Positive change was observed for both teams. For both teams, changes in their supports for critical thinking and use of assessment practices made the greatest gains.
Figure 3 Team 1 SSTEW scores overtime (pre, mid-way, and post project).
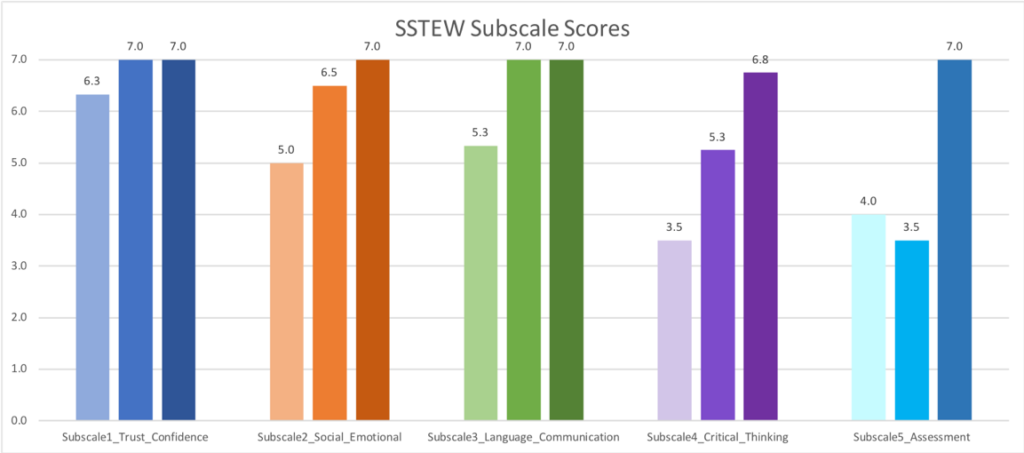
Figure 4 Team 2 SSTEW scores overtime (pre, mid-way, and post project).
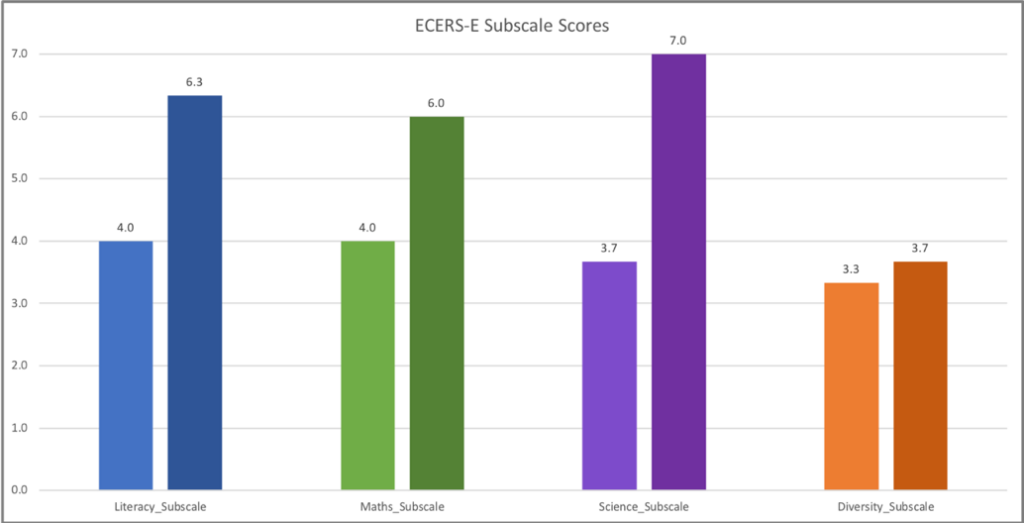
The Early Childhood Environment Rating Scale Curricular Extension (ECERS-E; Sylva, Siraj-Blatchford, & Taggart, 2010) is an extension of the Early Childhood Environment Rating Scale to examine key areas of curriculum such as literacy, numeracy, and science. The curricular practices identified in the ECERS-E make up some of the curricular content that might be embedded within SST or PLI interactions. Similar to the SSTEW, the ECERS-E has 4 subscales which are scored on a scale of 1 to 7 with scores of 2/3 representing adequate practice, 4/5 representing good practice, and 6/7 excellent practice. The subscales are:
- Sub-Scale 1: Literacy
- Sub-Scale 2: Maths
- Sub-Scale 3: Science
- Sub-Scale 4: Diversity
As seen in Figure 5 and Figure 6, positive change was observed for both teams across curricular areas. Note that the diversity subscale does not account for enacting a bicultural curriculum as the measure was developed in the UK. The focus in this subscale is on issues of gender, ability, and multi-cultural diversity.
Figure 5 Team 1 ECERS-E scores pre and post project.
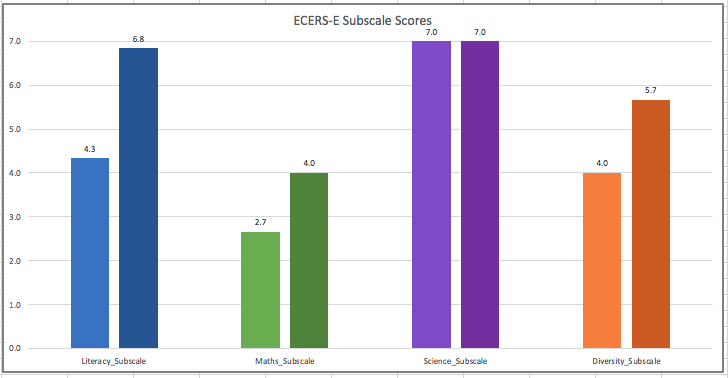
Figure 6 Team 2 ECERS-E scores pre and post project.
Access to data supported team motivation and implementation
In the TLRI project, we wanted to provide teams’ with detailed information about their use of SSTEW and ECERS-E practices. Within 1-2 weeks of the observation, each team received a written report on the observation. The report included graphed data for each area observed and a written summary of strengths in practice observed together with areas for the team to consider further development in. Teams were encouraged to use these reports, alongside their own copies of the SSTEW and ECERS-E to identify practices to focus on for their immediate inquiry cycle and development of action plans for practice implementation. This was a supported process with the teacher-researcher and critical friends.
Both teams reflected on how the SSTEW and ECERS data motivated and supported them during the end of project focus group.
Yeah and what was very cool was recently we’ve just had Tara and Sue do SSTEW and ECERS and so comparing the three times throughout the whole time, and between the first and last we’ve done some work and focused on our teaching in certain areas, and then it was able to show progress which was really cool. [Interviewer: And how did that feel for you, was that helpful?] Yeah, it’s good to know it works. It affirmed all that work that we were doing which could now be seen. And what was really exciting too was even the areas that we’re not necessarily focussing on, those areas were still developing, weren’t they, which came out with the comparison of the data. (Linton Post FG)
You don’t always get feedback on your practice [or at least] not like this and not this much. So, we could see over the time when we look at those three comparison observations, the shift in practice. It was really like, yeah, we have really taken so much onboard and applied it and we have really stepped up so that was cool to see those comparisons. (Makino Post FG)
And I think as we saw progress, it encouraged and excited you more and you just wanted to keep going. (Makino Post FG)
RQ 3 Summary
Our research sought to examine the changes that occurred in SST between teachers and children when using data-informed teaching. Notably, the graphed data and written feedback from the SSTEW and ECERS-E observation tools worked to provide a record of change while also being an influencing factor in the changes observed. Access to manualised practice observation tools and feedback is not common in ECE settings in Aotearoa New Zealand, yet these types of tools may provide teachers with important information to support and document change in practices.
RQ 4: How do changes in sustained shared thinking between teachers and children promote children’s progress across the curriculum learning outcomes?
Data from across the project data sources provide insights into how changes in SST between teachers and children promote children’s progress across Te Whāriki’s learning outcomes. Detailed accounts or case illustration stories about individual children’s learning are beyond the scope of this report. Overall insights from team’s reflection about children’s learning are summarised below.
Overall insights:
- Multiple data sources (each providing a unique piece of information) and the layering of data sources combined with team’s existing knowledge and partnerships with families and whānau supported teams to build a comprehensive picture of a child’s learning and experiences.
- Data enabled teams to better support individual children through enhanced differentiation of learning opportunities and more nuanced individualised planning.
- Intentional and focused support for children created opportunities for learning in targeted areas of need.
- Early data provided a useful marker of children’s capabilities to look back and reflect on to see how far children’s learning has progressed.
Examples of these overall insights are reflected in the following teacher reflections.
We know the children a lot better, and I think that’s helped us to know when it’s better to do more commenting opposed to those children for whom questioning is more relevant and appropriate to extend them. And I think that you really need to know the children in order to be able to do that. (Linton Post FG)
Whereas in the past, when we were planning we might have had lots of different things we were planning to focus on, I think we’ve got better at narrowing it down, haven’t we, and being real specific about what it is that we want to focus on with that child, and where to next. (Linton Post FG)
I think that all that all the intentional teaching strategies that we used to support her through the many emotional times built a solid foundation for her emotional resilience. Once she had improved her skills in this area it then opened those opportunities for her to lead her own learning and challenge herself. (Makino Post FG)
Conclusion
Our project was designed to develop new knowledge about the characteristics of SST, specifically to generate insights into how SST can be supported and enacted in Aotearoa New Zealand early learning settings. Our focus on SST was embedded within the expectations and responsibilities for kaiako outlined in Te Whāriki (MOE, 2017). The integration of a range of observation-based data tools supported nuanced understandings of SST and effective teaching practices for supporting SST and other positive learning interactions (PLI). Our project used data, knowledge, and action to support positive and powerful teacher-child interactions.
It’s a really non-threatening process and it’s all about positive and positive steps for you and the children. The scope for new learning is phenomenal and being open to that and realising that it is not in any way negative, it’s a positive from the get-go. (Makino Post FG)
The following section provides some concluding thoughts about data, SST, and the role of specific teaching practices. This is followed by a brief discussion of the delimitations in the present study and recommendations for practice, policy, and future research.
Data are powerful. When used in supportive and empowering ways, structured observation-based data tools can provide insights into children’s learning and teachers’ teaching that could not be obtained without the focused lens to guide what is observed. Moving beyond the collection of data, our results suggest that presenting numeric data graphically and making time for data discussions and the layering of multiple data sources supports teams to see connections within and across children’s learning and their teaching. The findings of this project illustrate the positive outcomes that can be achieved when teachers and leaders have appropriate systems, supports and mindsets to facilitate effective data use. This aspect is critically important as data without the appropriate understandings and supports also has the potential to be overwhelming, underused or used in ways that cause harm. Within the context of this project, teams used data in ways that are consistent with Te Whāriki principles of Whakamana, Kotahitanga, Whānau Tangata and Ngā Hononga (MOE, 2017, p. 17) to ensure empowering, holistic, family-focused, and culturally sustaining teaching and learning outcomes were achieved.
Building on the high-quality teacher-child interactions that were already occurring in the Kindergarten settings, this research took a deep look at sustained shared thinking. The data sources used have illuminated expected and unexpected aspects of these complex interactions, including the potential of shorter linked interactions that occur over time but when taken together comprise the key features of SST. This highlights the importance of revisiting learning which is regularly promoted in early learning settings. The findings also highlight that teachers can be planful and intentional to have SST interactions with children, recognising that extended 1:1 interactions will occur less frequently than other interaction types. Nonetheless, planning, coordination among team members, and the use of a wide variety of teaching strategies can support these opportunities. Teaching teams observed the more they knew about children and the wider the range of teaching strategies they considered, the better able they were to adjust and differentiate strategies across a range of diverse learners, such that all children benefitted from teachers working toward these SST interactions with the use of supportive data.
The present research project was designed to illuminate key aspects of SST interactions using a range of observation-based data tools. The study was exploratory and descriptive. The sampling of children for data collection days was based on focus children identified by teachers and convenience sampling (i.e., child consented and assented on the day). Thus, the data trends are not intended to be representative of the experiences of children in other contexts and are only a sample of the range of experiences for children in the participating contexts.
Nonetheless, this exploratory descriptive study provides new insights into SST and positive teacher-child learning interactions that may be useful for teachers in other settings or those supporting teachers to have high-quality, learning focused teacher-child interactions. The study also extends our research into the use of data by EC teachers and the potential for new data tools in early learning to be adopted and used more widely. Several key aspects of supporting effective data use have been highlighted through these findings. Given the findings of our study we offer the following recommendations:
To practicing teachers:
- There is reason for teaching teams to re-consider the ways in which they currently collect, interpret/analyse and use data to plan for teaching and learning in the ECE curriculum. Teachers in our study found that they did not know as much about individual children as they thought they did using their existing systems. Given these gaps, teachers may need to select a wider variety of appropriate data tools to ensure they have a more complete picture of the child and use this to support individual planning.
- There is reason for teachers to reflect on the amount of time that they spend talking and interacting with children, and the nature of such interactions. Teachers may want to consider the ways they can prioritise child interactions over other teaching responsibilities. In order to create the conditions for SST to occur without interruption, teams may need to work collaboratively to create flexible routines and provide interaction supports, such as stepping in to attend to other children when a colleague is engaged in an SST interaction. Moreover, when engaging in SST is not possible, teams may want to consider the use of sequences of positive learning interactions (PLI) to create similar quality of experiences across interactions.
To leaders and policy makers:
- Teachers need professional learning opportunities to support a wider and stronger repertoire of ways to notice, recognise and respond to young children’s learning as well as to reflect on and gain information about their own practice.
- Consider the structural drivers of quality such as group size, ratios, non-contact time and teacher qualifications that create the conditions to support enhanced opportunities for deeper engagement (sustained shared thinking) between teachers and children. These same structural drivers of quality are also needed for teachers to collect, analyse, and make use of a range of data tools. In addition to changes in policy and regulations, organisational leaders should explore ways to optimise appropriate data use and SST within their systems.
To researchers:
- Consider the role of researchers in practice-based research projects in which researchers work collaboratively with teachers to support their growth and agency to learn new skills. While it may be useful to start with existing systems and data tools, supporting teams to modify systems to better suit their context over time is also important so that impacts from applied interventions such as these are sustained over time. These modifications and adaptations should be done in ways that maintain the integrity and intent of tools and systems.
- Develop and disseminate exemplars of effective practices such as SST practices to support professional learning and development for pre-service and in-service teachers.
Our TLRI research has shown that when teachers work toward SST and PLI with the use of supportive data there is strong potential to enhance practice and benefit children’s learning. The use of new data tools about teachers’ practice and children’s experiences and learning may be new and unfamiliar for some ECE settings and notions of what constitutes useful data may be constrained. Nonetheless, we encourage ECE teachers and leaders to explore the range of data possibilities and supports to enhance practice and benefit teachers, children, and families and whānau.
References
Bocala, C., & Boudett, K. (2015). Teaching educators’ habits of mind for using data wisely. Teachers College Record, 117, 1-20.
Earl, L., & Timperley, H. (2008). Understanding how evidence and learning conversations work. In L. Earl & H. Timperley (Eds.), Professional learning conversations: Challenges in using evidence for improvement (pp. 1 – 12). Springer.
Datnow, A., & Hubbard, L. (2015). Teachers’ use of assessment data to inform instruction: Lessons from the past and prospects for the future. Teachers College Record, 117(4), 1-26.
Datnow, A., & Hubbard, L. (2016). Teacher capacity for and beliefs about data-driven decision making: A literature review of international research. Journal of Educational Change, 17, 7-28.
Gunmer, E., & Mandinach, E.B. (2015). Building a conceptual framework for data literacy. Teachers College Record, 117 (4),1–22.
McLaughlin, T., Cherrington, S., McLachlan, C., Aspden, K., & Hunt, L. (2018). Play and learning analysis system [Unpublished resource]. Institute of Education, Massey University, Palmerston North, New Zealand.
McLaughlin, T., Cherrington, S., McLachlan, C., Aspden, K., & Hunt, L. (2020). Building a data culture to enhance quality teaching and learning. New Zealand Council for Educational Research: Early Childhood Folio, 24, 3-8. https://doi.org/10.18296/ecf.0080
McLaughlin, T., Hunt, L., Cherrington, S., McLachlan, C., & Aspden, K. (2017). Data, knowledge, action pilot project. Pilot project funded through Institute of Education, Massey University, Palmerston North, New Zealand.
McLaughlin, T., Hunt, L., Cherrington, S., Aspden, K., & McLachlan, C. (2018). Child profile [Unpublished resource]. Institute of Education, Massey University, Palmerston North, New Zealand.
McLaughlin, T., Hunt, L., Cherrington, S., Aspden, K., & McLachlan, C., (2018). Child experience observation system [Unpublished resource]. Institute of Education, Massey University, Palmerston North, New Zealand.
Meade, A., Williamson, J., Stuart M., Smorti, S., Robinson, L., & Carroll-Lind, J. (2013). Adult-child sustained shared thinking: Who, how and when? Early Childhood Folio, 53, 7-12.
Ministry of Education. (2017). Te Whāriki: He whāriki mātauranga mō ngā mokopuna o Aotearoa, Early childhood curriculum. Author.
Podmore, V. (2006). Observation: Origins and approaches to early childhood research and practice. NZCER.
Siraj-Blatchford, I., Sylva, K., Muttock, S., Gilden, R., & Bell, D. (2002). Researching effective pedagogy in the early years, Research Report No. 356. http://dera.ioe.ac.uk/4650/1/RR356.
Siraj-Blatchford, I., Sylva, K., Taggart, B., Sammons, P., & Melhuish, E. (2003). Technical Paper 10—Case Studies of Practice in the Foundation Stage. London: Institute of Education.
Siraj-Blatchford, I. (2009). Conceptualising progression in the pedagogy of play and sustained shared thinking in early childhood education: a Vygotskian perspective. Educational and Child Psychology, 26, 77–89
Siraj-Blatchford, I. (2010). A focus on pedagogy: Case studies of effective practice. In K. Sylva, E. Melhuish, P. Sammons, I. Siraj-Blatchford, & B. Taggart (Eds). Early childhood matters: Evidence from the effective preschool and primary education project (pp. 149-165). Routledge.
Siraj, I., Kingston, D., & Melhuish, E. (2015). Assessing quality in early childhood education and care: Sustained shared thinking and emotional well-being scale. UCL IOE Press.
Snow, C. E., & Van Hemel, S. B. (2008). Early childhood assessment: Why, what, and how. The National Academies Press.
Sylva, K., Melhuish, E., Sammons, P., Siraj-Blatchford, I., & Taggart, B. (2004). The effective provision of pre-school education (EPPE) project: Technical Paper 12 – The final report. DfES / Institute of Education, University of London.
Sylva, K., Siraj-Blatchford, I., & Taggart, B. (2010). Assessing quality in the early years: Early childhood environment rating scale: Extension (ECERS-E), four curricular subscales. Trentham Books.
Timperley, H. (2010). Using evidence in the classroom for professional learning. [Paper presentation] Ontario Research Symposium, Ontario Canada.. http://www.educationalleaders.govt.nz/Pedagogy-and-assessment/Evidence-based-leadership/Data-gathering-and-analysis/Using-evidence-in-the-classroom
Timperley, H., & Robinson, V. (2001). Achieving school improvement through challenging and changing teachers’ schema. Journal of Educational Change, 2, 281-300. DOI:10.1023/A:1014646624263
Research team
Dr. Tara McLaughlin is a Senior Lecturer at Massey University. Her research focuses on inclusive early intervention and early years teaching and learning practices and professional learning and development.
Email: T.W.McLaughlin@massey.ac.nz
Associate Professor Sue Cherrington is the Director of the Institute for Early Childhood Studies, Victoria University of Wellington. Her research focuses on professional and pedagogical practices in early childhood education.
Email: sue.cherrington@vuw.ac.nz
Professor Claire McLachlan is Dean of the School of Education at Federation University Australia. Her research focuses on literacy, physical activity, curriculum, pedagogy, assessment and evaluation.
Email: c.mclachlan@federation.edu.au
Dr. Karyn Aspden is a Senior Lecturer at Massey University. She specialises in initial teacher education, practicum experiences, educational leadership and infant and toddler pedagogy.
Email: k.m.aspden@massey.ac.nz
Lynda Hunt is recently retired from a lengthy career as a kindergarten teacher with Ruahine Kindergarten Association, including multiple roles focused on research and building teacher researcher partnerships.
Email: lyndahunt767@gmail.com
Vicki Gifkins is postgraduate student and research coordinator across early childhood projects at Massey University. She comes from a background of teaching across the early childhood sector including in childcare, kindergarten, home-based and Playcentre settings.
Email: V.Gifkins@massey.ac.nz
Appendix 1: Two examples of CEOS observation reports
| Example Report 1 | Example Report 2 | |
 |
 |
|
 |
 |
|
 |
 |
Appendix 2: SSTEW Areas and Action Plans
- Sub-Scale 1: Building trust, confidence and independence (items 1-3)
- Item 1. Self-regulation and social development
- Item 2. Encouraging choices and independent play
- Item 3. Planning for small group and individual interactions/adult deployment
- Sub-Scale 2: Social and emotional well-being (item 4+8)
- Item 4. Supporting emotional well-being (Linton Phase 3 Action Plan)
- Item 8. Sensitive responsiveness
- Sub-Scale 3: Supporting and extending language and communication (items 5-7)
- Item 5. Encouraging children to talk with others
- Item 6. Staff actively listen to children and encourage children to listen
- Item 7. Staff support children’s language use
- Sub-Scale 4: Supporting learning and critical thinking (items 9-12)
- Item 9. Supporting curiosity and problem-solving (Makino Phase 1 Action Plan)
- Item 10. Encouraging sustained shared thinking through storytelling, sharing books, singing and rhymes (Linton Phase 1 Action Plan)
- Item 11. Encouraging sustained shared thinking in investigation and exploration (Linton Phase 2 Action Plan)
- Item 12. Supporting children’s concept development and higher-order thinking
- Sub-Scale 5: Assessing learning and language (items 13-14)
- Item 13. Using assessment to support and extend learning and critical thinking (Makino Phase 2 and 3 Action Plan)
- Item 14. Assessing language development