Executive Summary
The schools of South Auckland which have high proportions of Māori and Pasifika students have long been described by researchers as sites for low achievement, particularly in literacy (e.g., Ramsay, Sneddon, Grenfell & Ford, 1981). However, recent evidence suggests that the disparities between Māori and Pasifika students and other students in reading accuracy have been reduced, and that there has been a substantial reduction in the proportions of students in the lowest bands of achievement. Despite this, the evidence also suggests that at Year 4 and Year 9, the disparities in reading comprehension have continued, if not increased (Crooks & Flockton, 2005).
A research and development programme, conducted as a collaborative partnership between researchers, schools and the Ministry of Education, was designed to test several questions about achievement in seven decile 1 schools in South Auckland. These questions were:
- Can a research-practice collaboration develop cluster-wide and school based professional learning communities that are able to critically analyse and problem solve issues of instructional effectiveness, thereby developing more effective instruction that has a powerful educationally significant impact on Māori and Pasifika children’s comprehension at Years 4–9 in decile 1 schools?
- Can a set of effective instructional activities be identified that are able to be used by teachers to enhance the teaching of comprehension for Māori and Pasifika children in Years 4–9 in decile 1 schools?
In addition, there was a specific question about Samoan students and achievement in Samoan bilingual classrooms:
- Can the research and development programme contribute to more effective instruction for Samoan students in Samoan bilingual classes?
These questions were based on a set of hypotheses about the nature of effective instruction for reading comprehension, and the nature of effective school-based interventions. There were two main hypotheses: first, that more effective teaching could be developed through a professional learning community that has a continuing process of critical discussion and problem solving, based on evidence (Robinson & Lai, 2006); and secondly, that effective instruction would include a range of attributes, such as explicit teaching of strategies, and deliberate teaching of vocabulary (Pressley, 2002), but that these would need to be contextualized to the specific needs created by past histories of schooling and contemporary profiles.
The research and development programme was conducted over three years with up to 70 teachers and, in different years, between 1200 and 1900 students, over 90 percent of whom were Pasifika or Māori students. In the six Samoan bilingual classes from two schools, there were between 140 and 169 students across different years. A quasi-experimental design was employed to examine relationships between the programme and the outcomes over three years. The robustness of the design was enhanced by features such as a comparison with an untreated cluster of similar schools, and checks on subject attrition. Repeated measures of student achievement at the beginning and the end of each year, and a final measure at the beginning of the fourth year, form the basis of the design which, among other things, examines rates of gain against predicted patterns of growth generated from a baseline.
An initial step involved collecting baseline ‘profiles’ of achievement, using the standardised assessments of reading comprehension from PAT ( Reid & Elley, 1991), and of a range of aspects of reading comprehension, including decoding provided by STAR (Elley, 2001). It also involved collecting baseline profiles of classroom instruction, using systematic observations in classrooms. Together these baselines provided detailed evidence about strengths and weaknesses in the students’ reading comprehension, which were able to be mapped on to patterns of instruction in the classroom. For example, it showed that low decoding levels were generally not a problem; rather, it was patterns of checking and detecting threats to meaning in paragraph comprehension, and size and knowledge of vocabulary, that were posing difficulties. An unpredicted finding was that while high rates of explicit strategy instruction occurred, students were focused on the strategies as ends in themselves, and often resorted to guessing. Classroom observations showed a low incidence of teachers or students monitoring and checking strategies, and low rates of identifying and elaborating meanings of low frequency words, unusual uses of common words, or idiomatic uses.
The first phase included systematic feedback and analysis and problem solving at cluster, school and classroom levels, using the profiles as evidence. This process occurred each year thereafter. A second phase added targeted professional development, based on the evidence in the first phase, with all the Year 4–9 teachers. The third phase involved planned sustainability of the professional learning communities, with teacher designed projects and a cluster led conference.
At baseline, students were on average at stanine 3.1, approximately two years below expected levels, and this was generally the case, with some variation across year levels and across schools. To test the impact of the programme, a number of different analyses were made using longitudinal cohorts, comparisons with baseline projections, and total school population changes.
Analysis of achievement for longitudinal cohorts showed that by the end of the project, the average student now scored in the average band of achievement (stanine 4.21). The overall effect size for gains in stanines was 0.62. Māori students’ achievement accelerated at similar rates to those of the other ethnic groups participating in the project, so that by the end of the project, the average Māori student scored within the average band (mean =4.73), with one cohort of Māori students (Year 4) scoring above the national expected average at stanine 5.29. Males and females made similar rates of progress over the three years in the intervention, but female students, on average, started with higher levels of achievement than male students. On average, students in each school made accelerated gains in achievement from the beginning to the end of the project.
Analyses using the design format showed that after two years and after three years, students had statistically significantly higher achievement than baseline comparison groups (effect sizes ranged between 0.31 to 0.59), and were achieving statistically significantly higher than a comparison cluster of schools (effect sizes ranged between 0.33 and 0.61.)
When total school populations were analysed (which included new students entering and students leaving), a similar picture to that of the previous analyses emerged. The overall level of achievement showed a variable but increasing trend over time, so that by the end of the intervention, the average stanine for 1700 students at 7 schools was 3.61. A range of gains were made between schools and within schools across the three phases. Several factors were suggested as contributing to these differences in gains, including degree of participation by schools and teachers, and aspects of curriculum planning.
Observations of classroom instruction were carried out systematically in both the first and the second years. Significant changes in types of teacher and student exchanges relating to the focus of the intervention were linked to the pattern of the gains over two years in the component tests. Further case studies of teachers showed that a high gain teacher more often directed students’ awareness to the requirements of activities, clarified her high expectations, pushed her students with complex tasks, introduced more complex and less familiar language including idiomatic uses, created a classroom community that enjoyed the use and study of oral and written language, exposed students regularly to rich and varied texts, and was able to incorporate student cultural and linguistic resources, as well as clarifying areas of confusion.
The analyses of students in Samoan bilingual classrooms showed that the programme was effective in those classes too. Gains by students in the bilingual classrooms were at least as high as the gains by Samoan students in the mainstream classrooms, and in three of the year levels, they were noticeably higher. Students in bilingual classrooms were significantly lower in English reading achievement in Year 4 and Year 5, but from Year 6 onwards, their achievement levels in English were similar. Overall, cohorts made 1.13 stanine gain in two years; for four cohorts, this was a higher rate of gain than for Samoan students in mainstream classes. Gains in these classrooms could also be linked with the degree of participation by schools and teachers.
We concluded that it is possible to develop more effective teaching that impacts directly on the reading comprehension achievement of Year 4–9 children. The level of gains overall were in the order of one year’s gain in addition to nationally expected progress over three years. When these gains are considered in terms of the history of schooling in South Auckland, the educational significance of the gains, and the international literature of schooling improvement, they are seen to be substantial. Even when results for all the students present from the beginning to the end are considered, including those who subsequently left and those who subsequently entered the school, either from earlier levels or as new students from other schools, the levels of achievement at the schools have increased considerably. Given the quasi-experimental design with its additional strengths, these gains can be attributed with some confidence to the effects of the three phase model adopted by the research and development programme.
The analyses suggest that thinking about and critically discussing the evidence at a classroom, school and cluster level led to a significant part of the overall gains in achievement and that the professional learning communities had the capacity to use the evidence to make changes to existing practices. This is likely to be dependent on external support, in the form of collaborative research-practice-policy partnerships (e.g., Robinson & Lai, 2006). We need to consider how to foster such partnerships, in terms of both the kinds of partnerships being developed, and the infrastructure to support the development and sustainability of such partnerships.
The analyses of instruction show that specific aspects of instruction changed, including the focus on checking and detecting threats to gaining meaning in texts and boosting vocabulary acquisition, consistent with the focus of the programme and consistent with the gains that were made. But they indicated the need for caution in making assumptions about instructional and learning needs from the existing literature alone. They also indicated that effective instruction needs to be designed to fit the context-specific needs created by past histories of schooling and contemporary profiles. Interestingly, gains on the decoding test also increased to about the same degree as gains in other areas, despite not being a direct target of the intervention.
The educational intervention also impacted on Samoan students’ achievement in bilingual classrooms, demonstrating that Samoan students in bilingual classes can develop literacy in English to levels similar to those of other Samoan students who are not in bilingual classes. The evidence also shows that developmental changes in English comprehension come to reach mainstream levels by around Year 6, but that this rate of change may be modifiable too. It is important to see these results in a wider developmental and educational context, involving bilingual and biliteracy development in these classes.
1. Introduction
Yesterday was too late?
In 1981, Peter Ramsay (Ramsey, Snedden, Grenfell & Ford, 1981) and his colleagues at the University of Waikato completed a study of the schools in South Auckland. The title of their report was Tomorrow may be too late. They argued that there was an impending crisis created by “educational disadvantage suffered by most school-aged students in Mangere and Otara” who were “achieving well below their chronological age” (p. 41). They concluded with “a plea for urgency as the needs of the children of Mangere and Otara are very pressing. Tomorrow may be too late!” (p. v).
The gap in achievement between Mäori and non-Mäori children in mainstream schools is not a recent phenomenon. Earlier reports, such as the Currie (1967) and Hunn (1960) reports on education in the 1950s, had identified this difference as important and as urgently in need of a solution (see also Openshaw, Lee & Lee, 1993). The long standing on the “problem” for Mäori students is important to note, because some commentaries suggest it is relatively recent, and can be linked to changes in methods of teaching reading and writing which began in the 1960s (Awatere Huata, 2002; Nicholson, 2000).
Yet the historical picture is not entirely bleak. There is evidence that in the colonial period, there were times when Mäori children outperformed other children in some schools. Some evidence for this can be found in the Survey of Native Schools for 1930 (Education Gazette, 1 December 1930, Department of Education, 1930; see also McNaughton, 2000).
The sense of crisis that Ramsay expressed for the sake of children, communities and families is also present in reports from other countries (Snow, Burns & Griffen, 1998). The need is identified for communities who have, relative to the mainstream communities, less economic and political power, whose children are considered to be “minorities”. But there has been little evidence that the crisis is able to be solved in schools. In the United States, Borman (2005) shows that national reforms to boost the achievement of children in low performing schools serving the poorest communities have produced small gains in the short term (of the order of effect sizes of less than 0.20), but that after seven years, in those few schools that sustain reforms over a long period, the effects increase (estimated to be around effect sizes of 0.50). When considered across the country, while some achievement gains have occurred, they have typically been low and need to be accumulated over long periods of time.
At a more specific level, some studies from the United States have shown that clusters of schools serving ‘minority’ children have been able to make a substantial difference to the achievement of children. In one set of studies (Taylor, Pearson, Petersen & Rodriguez, 2005), researchers intervened in high poverty schools with carefully designed professional development research and development. They too found small cumulative gains across two years. This study and others pointed to important school level factors that must be in place in order for all children to achieve at high levels in reading. Summarising these, Taylor et al. (2005) noted six key elements: improved student learning; strong building leadership; strong staff collaboration; ongoing professional development; sharing student assessment data; and reaching out to parents. In these studies, there is evidence that achievement can be effected, and in the case of studies such as Taylor et al., that small gains over two years could be attributed to these characteristics.
The days after Ramsay’s tomorrow
Where does such offshore evidence leave the schools of South Auckland, which, according to Ramsay, had already received substantial additional resources by the early 1980s? There is little evidence that Ramsay’s concern led to immediate changes. The evidence from both national and international comparisons suggests that by the beginning of the 1990s, the children in decile 1 schools, and more generally children who were Mäori and Pasifika, were still not achieving as well as non-Mäori and non-Pasifika children in reading comprehension. The reading comprehension comparisons across 32 countries in the International Association for Evaluation of Educational Achievement study (see http://www.iea.nl/reading_literacy.html) provided stark evidence of what came to be called a “long tail” in the distribution of achievement. The problem was that while in general New Zealand continued to have high average achievement, and the best students in New Zealand were superior to other students in the world, Mäori and Pasifika children were over-represented in the “long tail” (Elley, 1992; Wagemaker, 1992).
In New Zealand, the recognition of the distribution problem, as well as other research developments, has had an effect. Reports by a Literacy Task Force (1999) and a Literacy Experts Group (1999) contributed to a national policy shift, which was implemented in the National Literacy and Numeracy strategy. The policy shift promoted concerted professional development and research practice development which was focused on Years 1–4 and Mäori and Pasifika children, especially those in decile 1 schools.
Associated with this policy and practice shift, there is now evidence from the national educational monitoring project (NEMP) and renorming exercises that changes in the targeted areas have occurred (Elley, 2005). The news is positive for the early stages of literacy instruction. From NEMP, the one area in literacy achievement where there are clear changes is in reading decoding, both accuracy and fluency (Flockton, & Crooks, 2001). Their second cycle of assessments of reading showed that the percentages of children reading below age level in reading accuracy at Year 4 had reduced markedly from 1996 to 2000, from around 20 percent to around 13 percent.
Little improvement occurred for Year 8 children in oral reading (Flockton & Crooks, 2001). A recent renorming of standardised assessments at Year 1 (6 years) conducted in 2000 also suggests that knowledge of letters and sounds has improved (Clay, 2002).
These increases in oral reading accuracy were found to have been maintained in the third (2004) cycle of assessments at Year 4. Further notable increases in accuracy were found for the Year 8 children, with only around 11 percent at both year levels now reading below age level (Crooks & Flockton, 2005). The breakdown of gains in 2000 and 2004 suggest that reading accuracy had improved at similar rates at Year 4 for both Mäori and Pakeha children (Flockton, 2003). But by 2004, the analyses showed substantial reduction at Year 4 in the gap between Pakeha and Mäori students (see further comment nemp.otago.ac.nz/forum_comment/2004).
Research based interventions using experimental designs have shown that the gaps at this early stage can be reduced considerably. We also know many of the characteristics of effective teaching at that early stage. For example, in the “Picking up the Pace” research with Mäori and Pasifika children in decile 1 schools in Mangere and Otara, their typical achievement was two stanines[1] below average levels in areas of decoding after a year at school (Phillips, McNaughton, & MacDonald, 2004). A research based intervention used professional development with teachers and teacher leaders to increase effectiveness in areas of reading and writing, including specific phonics instruction. Where teaching approaches were fine-tuned to solve children’s confusions and to make the purpose of classroom activities more obvious, and higher expectations about achievement were developed through evidence based analyses of progress, the children’s achievement was raised to close to the national distribution (see Phillips, McNaughton, & MacDonald, 2004). In some areas, such as alphabet knowledge, their progress was as good as or better than typical progress; in others, e.g. progress through text levels, they closely approximated typical progress; but in one area, generalized word recognition, they were still noticeably below average levels.
“Tomorrow” is still the same for reading comprehension
These indicators of progress are cause for some celebration, given the urgency signalled in Ramsay’s report, and the seemingly intractable nature of the teaching difficulty over decades. But the news has not all been good. For reading comprehension, little appeared to have changed for Mäori and Pasifika children in low decile schools over the period in which the decoding changes occurred, as we will show below. The NEMP data indicate increases in levels of comprehension in Year 4 from 1996–2000, but the breakdown of the achievement patterns suggests a substantially wider disparity between Mäori and non-Mäori in comprehension both at Year 4 and at Year 8. Furthermore, for children in low decile schools, gaps in comprehension increased both at Year 4 and at Year 8 (Flockton, 2003).
In the third cycle of assessments in 2004, the gains in oral reading accuracy were not matched by similar gains in reading comprehension for the total group of students at either Year 4 or Year 8. The detailed comparisons suggest that the gaps in oral reading accuracy between Mäori and Pasifika students and Pakeha students which had closed between 1996 and 2000 reduced further in 2006. But this was not matched in comprehension (Crooks & Flockton, 2005). Commentaries on this 2004 report note that Mäori children performed well in decoding, but there were large differences in favour of Pakeha in aspects of comprehension (nemp.otago.ac/forum_comment/2004). These differences were apparent for Pasifika children too, and they were apparent for decile 1-3 schools when compared with other decile groups (Crooks & Flockton, 2005).
This is true also of at least some of the schools in South Auckland. When we completed what we describe further in this report as a baseline profile of a cluster of schools in Mangere, we found that across schools and year levels, achievement in reading comprehension was relatively flat at around stanine 3, and something like two years below what would be expected as average progress nationally (Lai, McNaughton, MacDonald, & Farry, 2004). We have since repeated this finding with a cluster of Otara schools. They too were, on average, around stanine 3 across year levels and across schools (Lai, McNaughton, MacDonald, Amituanai-Toloa & Farry, 2006).
What we now know is that even if we achieve a dramatic change in teaching early reading, it does not necessarily mean that the gap reduces further on up the system. Experimental demonstrations specifically targeting the teaching of phonics also tend to show very limited transfer to comprehension (Paris, 2005). Recent national data from the AsTTle project across multiple dimensions of reading comprehension confirm the NEMP picture of large differences between Mäori and Pasifika children which are stable across decile levels, despite significant trends of higher achievement from lower to higher decile level schools (Hattie, 2002).
These comparisons need to be treated with an important qualification. The broad description of these disparities can mask important aspects of the literacy development and achievement of children in so-called “minority” groups. The conventional indicators of school literacy represent some of what children learn about literacy. But children who are in communities which have low employment, low incomes, and minority cultural and language status have engaged in a range of literacy and language activities, some of which might be quite different from mainstream children. Their knowledge, therefore, may not be well represented in tests of conventional literacy practices, especially at the beginning of schooling (McNaughton, 1999; Snow, Burns, & Griffen, 1998) and as they move into the middle school levels.
Here, it is important to note that there is an urgent challenge which has strategic importance to all of New Zealand. Students need greater ranges and levels of knowledge and skills for post secondary school study and for employment. Education is increasingly important to the success of both individuals and nations (Darling-Hammond & Bransford, 2005). Over-representation of particular groups in low achievement bands is not acceptable at individual, community or national levels, no matter what the proportion of the population. It is a pressing matter of cultural, political, constitutional (Treaty of Waitangi), ethical, economic and educational significance that we develop more effective forms of instruction for these students. It is worth noting that by 2021, Mäori children will comprise 28 percent and Pasifika children 11 percent of all the under-15-yearolds in New Zealand (Statistics New Zealand, 2002). In Mangere and Otara schools, children from these communities already make up over 90 percent of many school rolls.
There is an additional dimension to that challenge. Many of the children in the South Auckland schools have a language other than English as their home language. Yet language development for these children is not well understood. In the context of bilingual instruction, for example, and the relationships between development in two languages and two systems of literacy, little is known about biliteracy development and relationships with literacy and literacy instruction (Sweet & Snow, 2003).
The research we report here has two foci. There is a main study of seven schools, their teachers and their students. Within this, there is a second study specifically of teachers and students in Samoan bilingual classrooms. This is the first time, to our knowledge, that there has been a specific research based intervention with Samoan students in bilingual programmes which looks at their achievement.
Twenty-five years after the Ramsay report, we can report in this study important gains in reading comprehension in Year 4–9 students in decile 1 schools in Mangere. This report describes the science of these changes and documents the research and development programme that have taken place. However, the science is closely bound up with a policy context of associated changes in practices. It is likely that without the policy context, the science involved in developing more effective instruction would have achieved less. The results reported here need to be considered with this policy context in mind (Annan & Robinson, 2005).
In addition, the research is located in a particular historical context of school-based interventions. One is the landmark study “Picking up the Pace” (Phillips, McNaughton & MacDonald, 2001). As noted above, this focused on instruction in the first year, and set out to examine the separate and combined effects on children’s achievement of providing co-ordinated professional development to teachers in early childhood settings, and to teachers of children in their first year of schooling. Since the success of that project, which was completed in 2001, further professional development for Year 1 teachers has occurred, based on the practices identified in the research, and the programme in some schools has been extended through to Year 3.
That study and its further development were part of a much broader project initiative, “Strengthening Education in Mangere and Otara” (SEMO), which aimed to raise the achievement levels of children in these two areas. SEMO’s general aim was to strengthen schools in the area and to enhance children’s learning opportunities, particularly in literacy, by enhancing the work of early childhood and primary teachers who were providing literacy programmes. SEMO was succeeded by a further policy and practice development in Mangere and Otara, “Analysis and Use of Student Achievement Data” (AUSAD). This project is located within that government-funded school improvement initiative. The goal of AUSAD is to offer high quality learning environments to raise achievement. This is done by using student achievement information to inquire into the nature of the under-achievement, to test competing explanations of its cause, and to monitor the impact of teachers’ decisions about how to intervene. In short, the focus is on developing the inquiry skills of teachers to improve school practices and student learning outcomes. The initiative comprises a number of interventions focusing on improving literacy and numeracy achievement (e.g., the “Third Chance” programme aimed at improving literacy in Years 1–3).
Reading comprehension
Recent commentaries identify a major theoretical challenge facing literacy instruction. Now that some of the pressing issues in beginning reading instruction (but by no means all) have been resolved, the challenge concerns the teaching of reading comprehension. Higher levels of reading comprehension and related areas of critical thinking are central to the purposes of contemporary schooling, and are part of the education priorities and key competencies that have been set for New Zealand education (Ministry of Education, 2005). But there is a critical need for research into instruction that enhances comprehension, and into interventions that enable schools to teach comprehension effectively. The most recent reviews of relationships between research and practice note that overall evidence of teacher effectiveness is limited, and that research has not impacted greatly on effective comprehension instruction (see Block & Pressley, 2002). Similarly, the RAND reading study group, which was set up in 1999 by the US Department of Education’s Office of Educational Research and Improvement to identify the most pressing needs for research in teaching reading, has concluded:
We have made enormous progress over the last 25 years in understanding how to teach aspects of reading. We know about the role of phonological awareness in cracking the alphabetic code, the value of explicit instruction in sound–letter relationships, and the importance of reading practice in producing fluency.… The fruits of that progress will be lost unless we also attend to issues of comprehension. Comprehension is, after all, the point of reading. (Sweet & Snow, 2003, p. xii)
The challenges to teaching effectively have been identified (Pressley, 2002; Sweet & Snow, 2003). One is the need to build on the gains made in research about instructional practices for beginning literacy. A second is to do with knowledge transfer, a failure to turn all that we know about comprehension and comprehension instruction into generally more effective teaching.
These needs are particularly significant for schools serving culturally and linguistically diverse populations in low income areas (Garcia, 2003).
As noted above, on average, students in the middle years of school in New Zealand have high levels of reading comprehension, judged by international comparisons; however, there are large disparities within the distribution of achievement. These are between children from both Mäori and Pasifika communities in urban schools with the lowest employment and income levels, and other children (Alton-Lee, 2004). These findings highlight the need for instructional approaches that enable teachers to develop, use and sustain effective teaching of reading comprehension with culturally and linguistically diverse students. For Pressley (2002), this challenge represents an application problem. We know a lot about what students need to be able to do, which includes such things as regulating strategy use, and we know a lot about specific instructional effects, such as the need for explicit strategy instruction. What he claims we have failed to do is translate that knowledge into widespread usage with known effects. While Sweet and Snow echo this claim in their RAND summary of reading comprehension instruction, they also argue that there is yet more to be known about specific teaching and learning relationships, especially in the context of diverse readers, diverse text types and diverse instructional contexts (Sweet & Snow, 2003).
Generally, there is considerable consensus around what students need to learn, and what effective teaching looks like. In order to comprehend written text, a reader needs to be able to decode accurately and fluently, and to have a wide and appropriate vocabulary, as well as appropriate and expanding topic and world knowledge, active comprehension strategies, and active monitoring and fix up strategies (Block & Pressley, 2002; Pressley, 2002). So it follows that children who are making relatively low progress may have difficulties in one or more of these areas. The consensus around teaching effectively identifies attributes of both content (curriculum) and process (Taylor et al., 2005). For the middle grades, these include instructional processes in which goals are made clear, and which involve both coaching and inquiry styles that engage students in higher level thinking skills. Effective instruction also provides direct and explicit instruction for skills and strategies for comprehension. Effective teaching actively engages students in a great deal of actual reading and writing, and instructs in ways which enable expertise to be generalisable and through which students come to be able to self regulate independently.
In addition, researchers have also identified the teacher’s role in building students’ sense of self efficacy and, more generally, motivation (Guthrie & Wigfield, 2000). Quantitative and qualitative aspects of teaching convey expectations about students’ ability which affect their levels of engagement and sense of being in control. These include such things as text selection. Culturally and linguistically diverse students seem to be especially likely to encounter teaching which conveys low expectations (Dyson, 1999). There are a number of studies in schooling improvement which have shown how these can be changed. In general, changes to beliefs about students and more evidence based decisions about instruction are both implicated, often in the context of school wide or even cluster wide initiatives (Bishop, 2004; Phillips et. al., 2004; Taylor et. al., 2005).
Just as with the components of reading comprehension, it follows that low progress could be associated with teaching needs in one or more of these areas. Out of this array of teaching and learning needs, those for students and teachers in any particular instructional context will have a context specific profile. While our research-based knowledge shows that there are well established relationships, the patterns of these relationships in specific contexts may vary. A simple example might be whether the groups of students who make relatively low progress in a particular context, such as a cluster of similar schools serving similar communities, have difficulties associated with decoding, or with use of strategies, or both, and how the teaching that occurs in those schools is related to those difficulties.
Several hypotheses are possible for the low levels of reading comprehension which are tested in the following research. One is that children’s comprehension levels are low because of low levels of accurate and fluent decoding (Tan & Nicholson, 1997). A second is that children may have learned a limited set of strategies; for example, they may be able to recall well, but are weaker in more complex strategies for drawing inferences, synthesising and evaluation; or they may not have been taught well enough to control and regulate the use of strategies (Pressley, 2002). Other possible contributing reasons might be more to do with language: that is, children’s vocabulary may be insufficient for the texts used in classroom tasks (Biemiller, 1999); or they may be less familiar with text genres. Well known patterns of “Matthew effects” may be present in classrooms, where culturally and linguistically diverse children receive more fragmented instruction focused on decoding or relatively simple forms of comprehending, or receive relatively less dense instruction, all of which compounds low progress (McNaughton, 2002; Stanovich, West, Cunningham, Cipielewski, & Siddiqui, 1996). There is also a set of possible hypotheses around whether the texts, instructional activities and the pedagogy of the classroom enable cultural and linguistic expertise to be incorporated into and built on in classrooms (Lee, 2000; McNaughton, 2002). But each of these needs to be checked against the patterns of instruction in the classrooms in order for the relationships to be tested.
This approach, which focuses on the need to understand specific profiles, has an implication for meeting the challenges posed by Pressley (2002) and Sweet and Snow (2003). Rather than test in an ad hoc way the significance of certain teaching and learning relationships, what we did in the study was to test a package of targeted relationships. These are relationships initially identified through a process of profiling both learning needs and patterns of existing instruction. The analysis is aimed at adding further to our research-based knowledge of relationships between teaching and learning in specific contexts, and thereby contributing to the research and application challenges signalled by Pressley (2002) and Sweet and Snow (2003).
We assume in this profiling that while much is known, there are still some areas where we need more knowledge and analysis. This need is pressing in the context of cultural and linguistic diversity. An example in our contexts is the role of activation and deployment of background knowledge. A theoretical argument is often made that instruction needs to incorporate more of the cultural and linguistic resources that minority children bring to classrooms (McNaughton, 2002). But complementing this is another argument: that students need to develop more awareness of the requirements of classroom activities, including the relationships between current resources and classroom activities (McNaughton, 2002). While the general hypothesis of the significance of background knowledge is well demonstrated in controlled studies of reading comprehension (Pressley, 2002), the particular idea of teachers being able to incorporate this, and balancing it with enhancing awareness of classroom requirements, has not been well tested.
In the following study we draw on known properties of effective comprehension and on known relationships between types of instruction and learning outcomes. But we apply this knowledge in an intervention context. Within that context, we test the significance of the assumed relationships and features of teaching and learning. Because the context includes substantial numbers of children for whom English is a second language and who come from diverse cultural backgrounds, this is also a context for discovering new learning needs and new relationships between teaching and learning.
Professional learning communities and critical analysis of evidence
A previous study, focused on literacy achievement over the transition to school, demonstrated substantial gains across a cluster of 12 decile 1 urban schools with primarily Mäori and Pasifika students (Phillips, McNaughton & MacDonald, 2001). Among other things, the programme involved intensive collection and analysis of achievement data within schools and across a group of schools. Instructional approaches were modified to impact more strongly on increasing student engagement and teaching effectiveness around agreed goals. Team leaders within schools led professional communities. While the initial development took place within schools over six months, the programme has now been in place in schools for several years. Follow-up research has indicated that those schools which maintained and built on these processes through a professional learning community focused on teaching and learning have increased student achievement over time (Timperley, Phillips & Wiseman, 2003).
The features of these learning communities appear similar to those described by Newman, Smith, Allensworth and Bryk (2001). They identify high “instructional programme coherence”, a necessary condition for improvements in student achievement that are more likely to be sustained over time. These authors define high instruction coherence as “a set of interrelated programmes for students and staff that are guided by a common framework for curriculum, instruction, assessment, and learning climate and that are pursued over a sustained period” (p. 229). The elements suggested which are crucial to high instructional programme coherence can be identified in the Phillips, McNaughton and MacDonald (2004) programme. They include a common instructional framework for teaching literacy across all schools involved in the programme; teachers working together to implement the common programme over a sustained period of time; and assessments which are common across time. Both the New Zealand programme and the high programme coherence schools in the USA rely on long-term partnerships between schools and external support organisations, the development of a common framework for literacy diagnosis which every teacher has to implement, expected collaboration between teachers, joint decisionmaking around assessments to use, and similar factors.
Underlying many of the features of schools with high programme coherence is the use of evidence to guide and evaluate teaching practices. For example, the aim of AUSAD was for practitioners to use student achievement data to inform practice. This has led directly to planning how to design classroom programmes that specifically meet the needs of students in these diverse urban schools. The partnership has responded to the increasing calls for greater understanding of the teaching and learning of comprehension to inform practice in New Zealand (e.g. Literacy Task Force, 1999; Learning Media, 2003) and internationally (Pressley, 2002).
Similarly, critical analysis of student data is identified as significant in school and teaching effectiveness research (e.g. Hawley & Valli, 1999; Robinson & Lai, 2006). In their literature review on effective professional development, Hawley and Valli (1999) identify critical analysis as a more effective form of professional development than traditional workshop models. The collection, analysis and discussion of evidence was present in the schools maintaining gains in the Phillips et al. (2004) programme (Timperley et al., 2003).
A general question that arises is how much the critical analysis process contributes to the student changes in successful programmes. In the research and development programme reported here, the question concerns its contribution to the development of more effective teaching of reading comprehension in schools serving culturally and linguistically diverse students in low income communities. The collection, analysis and discussion process took place in the context of collective analytic and problem solving skills, where teachers collaborated with researchers and professional developers to co-construct the professional development. It is important to note here our assumption that professional expertise was distributed within and across schools, and that teachers would be able to contribute as co-participants in a research-based collaboration (McNaughton, 2002). The issue of how teachers are viewed is particularly salient in the New Zealand context, as recent research syntheses show that school effects are consistently smaller than teacher/class level effects. These latter effects can account for up to 60 percent of the variance in student achievement, depending on the subject areas, level of schooling and outcome of interest, as estimated by Alton-Lee (2004).
This sort of collective problem solving represents one way of balancing two tensions identified in effective educational interventions (Coburn, 2003; Newman et al., 2001). One tension is around the issue of guaranteeing fidelity by adhering to a set of instructional procedures used in wellresearched interventions, versus developing procedures which are derived from context specific problem solving, but may have a less well known research intervention base. A related tension is between importing a set of procedures, in a way which risks undermining local autonomy and efficacy, and a more collaborative development of common procedures, which risks losing instructional coherence. It seems to us that it is possible to construct fidelity to a common programme which has been strongly contextualised by developing a highly focused collaborative context. There is research evidence that suggests approaches in which professional development focuses on joint problem solving around agreed evidence, such as student achievement outcomes, is more likely than predetermined programmes to result in sustainable improvements in student achievement, particularly in reading comprehension (Coburn, 2003; Hawley & Valli, 1999; Timperley, Phillips & Wiseman, 2003).
Evidence is critical to the processes of developing a professional learning community capable of solving the instructional problems associated with more effective teaching. Systematic assessment for formative and diagnostic purposes is essential in order to avoid the problems we have found before, where educators assume that children need a particular programme or approach, but close inspection of the children’s profiles shows that they already have the skills targeted in those approaches (McNaughton, Phillips, & MacDonald, 2003). The significance of collecting and analysing data, rather than making assumptions about what children need (and what instruction should look like), was recently underscored by Buly and Valencia (2002). Policy makers in the State of Washington had mandated programmes without actually analysing profiles of low progress students, identified by test scores from fourth grade National Assessment of Educational Progress (NAEP) scores. The assumption underlying policies and interventions was that poor performance reflected students’ difficulties with more basic decoding abilities. Yet there was little data about this assumption, and little evidence to show that focusing on such skills would improve comprehension at fourth grade. Using a broad band of measures, Buly and Valencia identified five groups of low progress readers, some of whom did indeed have limited fluency and accuracy in decoding. However, mandating phonics instruction for all students who fell below the proficiency levels had missed the needs of the majority of students, whose decoding was strong, but who struggled with comprehension or language requirements for the tests. This finding highlights the need for research-based applications of best practice, based on analyses of student needs. One particular need that has been identified in other countries is for more effective teaching of reading comprehension than has typically been the case (Sweet & Snow, 2003).
The issue of sustainability
Developmental sustainability
A major challenge has been created by the advances made in schooling improvement and increasing instructional effectiveness through professional development. This is the issue of sustainability (Coburn, 2003). For the following research and development programme, sustainability has two meanings. The immediate concern facing the schools in South Auckland has been the need to build further progress in literacy, adding to the more effective instruction in the early years. This inevitably means considering the quality of the teaching and learning of comprehension (Sweet & Snow, 2003). The issue in the decile 1 schools is that the subsequent instructional conditions set channels for further development, and if the channels are constructed for relatively ‘low’ gradients of progress, this creates a need for further intervention. Unfortunately, as we have already noted and describe further below, the available evidence shows that despite the gains in decoding, there were still wide and possibly increasing disparities in achievement on comprehension tasks for Mäori and Pasifika children, particularly in low decile schools (Flockton & Crooks, 2001; Hattie, 2002; Lai, McNaughton, MacDonald & Farry, 2004).
The reason for needing to deliberately build this sustainability resides in the developmental relationships between decoding and comprehension. Logically, there are relationships such as the one identified by Tan and Nicholson, (1997), who showed that poor decoding was associated with poor comprehension. It makes perfect sense, that if you can’t get the words off the page, you can’t comprehend. The problem is that the corollary doesn’t apply—decoding may be a necessary condition, but it is not a sufficient condition. So being a better decoder does not automatically make you a better comprehender.
The developmental reason for this can be found in Paris’s (2005) multiple components model of literacy development, or Whitehurst and Lonigan’s (2001) ‘inside outside’ model of the strands of literacy development. Each of these explains that there are different developmental patterns associated with acquisition for components such as items, and for language meaning and uses, and they are somewhat independent. This accounts for the phenomenon of rapid, accurate decoders who are not able to comprehend, which is described by professional educators and researchers (McNaughton, Lai, MacDonald & Farry, 2004). There is another developmental reason. Inoculation models do not apply to most phenomena in teaching and learning; just because you know and can do some stuff this year doesn’t mean that you automatically make further gains next year. It depends at least in part on whether the teacher you meet effectively enables you to build on to and extend your learning. Fluent, accurate decoding is a necessary but not a sufficient condition for developing further comprehension skills (Block & Pressley, 2002; Sweet & Snow, 2003).
Sustainability of effective professional learning community
There is a second meaning for sustainability. We now need to know which properties of teaching practices in schools enable success to be sustained with new cohorts of students and new groups of teachers joining schools (Timperley, 2003). Although effective practices may be able to be identified, this is an additional challenge. Sustaining high quality intervention, it now seems, is dependent on the degree to which a professional learning community is able to develop (Coburn, 2003; Toole & Seashore, 2002). Such a community can effectively change teacher beliefs and practices (Annan, Lai, & Robinson, 2003; Hawley & Valli, 1999; Timperley & Robinson, 2001).
Several critical features of a collaboration between teachers and researchers are predicted to contribute to such a community developing (Coburn, 2003; Toole & Seashore, 2002; Robinson & Lai, 2006). One is the need for the community’s shared ideas, beliefs and goals to be theoretically rich. This shared knowledge is about the target domain (in this case, comprehension); but it also entails detailed understanding of the nature of teaching and learning related to that domain (Coburn, 2003). Yet a further area of belief that has emerged as very significant in the achievement of linguistically and culturally diverse students in general, and indigenous and minority children in particular, is the expectations that teachers have about children and their learning (Bishop, 2004; Delpit, 2003; Timperley, 2003).
Being theoretically rich requires consideration not only of researchers’ theories, but also of practitioners’ theories, and of adjudication between them. Robinson & Lai (2006) provide a framework by which different theories can be negotiated, using four standards of theory evaluation. These standards are accuracy (empirical claims about practice are well founded in evidence); effectiveness (theories meet the goals and values of those who hold them); coherence (competing theories from outside perspectives are considered); and improvability (theories and solutions can be adapted to meet changing needs, or to incorporate new goals, values and contextual constraints).
This means that a second feature of an effective learning community, already identified above, is that their goals and practices for an intervention are based on evidence. That evidence should draw on close descriptions of children’s learning as well as descriptions of patterns of teaching. Systematic data on both learning and teaching would need to be collected and analysed together. This assessment data would need to be broad based, in order to understand the children’s patterns of strengths and weaknesses, to provide a basis for informed decisions about teaching, and to clarify and test hypotheses about how to develop effective and sustainable practices (McNaughton, Phillips & MacDonald, 2003). This means that the evidence needs to include information about instruction and teaching practices.
However, what is also crucial is the validity of the inferences drawn, or claims made, about that evidence (Robinson & Lai, 2006). The case reported in Buly & Valencia (2002), for example, shows how inappropriate inferences drawn from the data can result in interventions that are mismatched to students’ learning needs. Robinson & Lai (2006) suggest that all inferences be treated as competing theories and evaluated.
So a further required feature is an analytic attitude to the collection and use of evidence. One part of this is that a research framework needs to be designed to show whether and how planned interventions do in fact impact on teaching and learning, enabling the community to know how effective interventions are in meeting its goals. The research framework adopted by the community needs therefore to be staged so that the effect of interventions can be determined. The design part of this is by no means simple, especially when considered in the context of recent debates about what counts as appropriate research evidence (McCall & Green, 2004; McNaughton & MacDonald, 2004).
Another part of the analytic attitude is critical reflection on practice, rather than a comfortable collaboration in which ideas are simply shared (Annan, Lai & Robinson, 2003; Ball & Cohen, 1999; Toole & Seashore, 2002). Recent New Zealand research indicates that collaborations which incorporate critical reflection have been linked to improved student achievement (Phillips et al., 2004; Timperley, 2003) and to changed teacher perceptions (Timperley & Robinson, 2001).
A final feature is that the researchers’ and teachers’ ideas and practices need to be culturally located. We mean by this that the ideas and practices that are developed and tested need to entail an understanding of children’s language and literacy practices, as these reflect children’s local and global cultural identities. Importantly, this means knowing how these practices relate (or do not relate) to classroom practices (New London Group, 1996).
The main research project
This project is a result of a three year research and development partnership between the Ministry of Education Schooling Improvement Initiative AUSAD, the seven schools in the Mangere cluster, and the Woolf Fisher Research Centre at the University of Auckland.[2] The representatives from the seven schools formed a Senior Assessment Team (SAT) to work with researchers, the Ministry of Education and the Initiative leaders on developing an intervention to raise student achievement.
The collaboration involved an innovative approach to research practice partnerships. The purpose was to determine the extent of the challenges for effective teaching of comprehension, and to create better teaching methods to meet those challenges. As part of this, a cluster wide intervention for all teachers teaching classes at Years 4–8 (and in one school, Year 9 also) in the seven schools took place. This required extensive school-based professional development, as well as systematic collection of achievement data and classroom observations within a rigorous research design. The research-based intervention was designed to test both the discrete components of effective teaching in school-wide implementation, and the model developed for a research-school practice partnership.
Embedded in the overall programme was a Samoan bilingual study. This involved two of the schools, with 177 Samoan children in six classes in Years 4–8. While the overall project’s main purpose was to enhance the comprehension achievement of all children, the Samoan bilingual study was an attempt to address how Samoan students and Samoan teachers learn and teach comprehension, given that they can speak and understand two languages (Samoan and English).
Research questions
This study: aims and research questions
This study aimed to raise the achievement in reading comprehension of students in seven Mangere schools, through a planned and sequenced research based collaboration. The study addresses several areas of strategic importance to New Zealand, as noted above.
The study also addresses specific theoretical questions. These are to do with the development of reading comprehension; effective instruction for reading comprehension; the development and role of professional learning communities; the role of (contextualised) evidence in planned interventions; and the nature of effective research collaborations with schools. The specific research questions were:
- Can a research-practice collaboration with seven decile 1 schools develop cluster-wide and school based professional learning communities that are able to critically analyse and problem solve issues of instructional effectiveness, thereby developing more effective instruction that has a powerful educationally significant impact on Mäori and Pasifika children’s comprehension at Years 4–9?
- Can a set of effective instructional activities be identified that are able to be used by teachers to enhance the teaching of comprehension for Mäori and Pasifika children in Years 5–8 in decile 1 schools?
A general hypothesis derived from these areas is that:
instructional approaches to reading comprehension present in the cluster of schools could be fine tuned to be more effective in enhancing achievement through a research practice collaboration, and the development of professional learning communities, using contextualised evidence of teaching and learning.
The research base for each of these areas is outlined in the following sections.
Samoan bilingual study
- The general aim of the Samoan bilingual study was to test the more general assumption that a major reason for lower than expected achievement for Samoan students on comprehension tests in schools was less than effective teaching.
What this report covers
This report describes the results of the research and development programme in action, as researchers and practitioners developed communities to meet the challenge of building more effective instruction for reading comprehension in linguistically and culturally diverse urban schools. The design methodology and frameworks for the interventions are described in Chapter 2. Chapter 3 describes the results of these interventions for the overall three year research and development partnership between schools and researchers. Results for the study of students in Samoan bilingual classes follows in Chapter 4. In the final chapter, results are summarised and discussed.
2. Methods
The overall partnership involved schools in the Ministry of Education Mangere Analysis and Use of Student Achievement Data (AUSAD) school improvement initiative, the initiative leaders, the Woolf Fisher Research Centre (University of Auckland) and Ministry of Education representatives.
Main study participants
Schools
The study involved seven decile 1 Mangere schools. Two of these schools are contributing schools (Year 1–Year 6); three are full primary schools (Year 1–Year 8); one is an intermediate school (Year 7–Year 8); and one is a middle school (Year 7–Year 9). The schools ranged in size from 292 students to 593 students.
Students
In the following study, we report on several overlapping groups of students. The first group consists of all the students present at the beginning of the three year study (Baseline sample). The second consists of three cohorts of students, initially from Year 4, Year 5, and Year 6, who were followed longitudinally for three years. The third group consists of all students who were present at the beginning and at the end of each year.
Overall baseline samples
Baseline data (February 2003) were collected from 1216 students in six of the schools (one school who joined the partnership was unable to participate in the first round of data collection) at the following levels: Year 4 (mean age 8 years, n=205); Year 5 (mean age 9 years, n=208); Year 6 (mean age 10 years, n=265); Year 7 (mean age 11 years, n=267); and Year 8 (mean age 12 years, n=271). The total group consisted of equal proportions of males and females from 14 ethnic groups. Four main groups made up 87 percent of the sample. These groups were Samoan (33%), Mäori (20%), Tongan (19%) and Cook Island (15%). Approximately half the children had a home language other than English.
Longitudinal cohorts
Several cohorts of students were followed longitudinally from Time 1 to Time 6; these were those students who were present at all 6 time points, a total of 238 students. There were three cohorts. Cohort 1 (n=114), those students who were Year at Time 1; Cohort 2 (n=56), those students who were Year 5 at Time 1; and Cohort 3 (n=68), those students who were Year 6 at Time 1. These students were a subset of the students included in the baseline sample.
Overall group year by year
A third group of students were those present at the beginning and end of each year. In Year 1 (2003), there were n=1216; in Year 2 (2004), there were n=1683; and in Year 3, there were n= 1619. All of the students who were in the longitudinal cohort group were part of these groups, but these groups also included students who were present for only a single year, including Year 7 and Year 8 students, new Year 4 students (in the second and third year), new students arriving at the school and staying at least a year, and students who were present for a year only.
Teachers
Around 70 teachers were involved in each year of the project, including literacy leaders. Characteristics of the teachers varied somewhat from year to year, but in general, around twothirds had five or more years of experience, and 10 percent were beginning teachers. A total of 11 percent were in bilingual classes (including Samoan, Tongan and Mäori bilingual classes). In the second year, 25 of the teachers (a third) were Pasifika or Mäori.
Samoan bilingual study participants
Students
Samoan bilingual baseline samples
Within the overall study, Year 4–Year 8 students from six Samoan bilingual classrooms were involved. There were between 24 and 30 students enrolled in each of the classes across two years A cross section at baseline of students at different school years, from Year 4 (aged 8) to Year 8 (aged 13), was assessed at the beginning of the school year in 2003. This cross-sectional group provided a baseline against which cohorts in the classrooms of the teachers receiving the professional development could be compared. The six Samoan bilingual classes operated in two schools (School A and School B) that were involved in the larger project. School A had three bilingual classrooms: a Year 7 classroom (12-year-olds), a Year 7/8 composite classroom (12- and 13-year-olds), and a Year 8 classroom (13-year-olds). These classrooms were in close proximity to each other, being located in one school building. School B had three bilingual classrooms also: two composite classes: a Year 4/5 (8- and 9-year-olds), and a Year 5/6 (9- and 10-year-olds) were housed in one part of the school, and the other, a Year 7/8 classroom, was housed in another part.
Samoan bilingual longitudinal cohorts
A second group involved several longitudinal cohorts and was based on the original baseline students. From each year, students who were continuously present at each of four time points— the beginning (assessed in February) and end (assessed in November) of both the 2003 and 2004 school years—are identified and described. Cohorts at each year level, from Year 4 through to Year 8, were repeatedly measured over two years. In the second year, the Year 8 cohort moved on to secondary schools. Given the large movement into and out of the classrooms, this meant there were 140 students represented in the baseline group, but between 10 and 35 students at each age level in the longitudinal cohorts.
Samoan mainstream samples
For comparison purposes, Samoan students in mainstream classes (n = 62 classes) from all seven schools involved in the overall project were identified. These students came from the same communities, but because there were only 67 Samoan students across Time 1 and Time 4 in School A and School B, it was decided to include all Samoan students in mainstream classrooms in the wider study for comparisons. The number of mainstream students across two years ranged from 345 to 456. Two samples of students were also used. Again, a cross-sectional baseline of students from different school years, from Year 4 (aged 8) to Year 8 (aged 12) was assessed at the beginning of the school year 2003. In addition, longitudinal cohorts were identified. From each year, students who were continuously present at each of four time points—the beginning (assessed in February) and end (assessed in November) of both the 2003 and 2004 school years— were identified and described. Cohorts at each year level, from Year 4 through to Year 8, were repeatedly measured over two years. In the second year, the Year 8 cohort moved on to secondary schools. With the larger movement into and out of the classrooms, this meant that there were 345 students at Time 1 represented in the baseline group (and at subsequent times, the number of mainstream students were: 451 at Time 2; 456 at Time 3; and 422 at Time 4); but these were between 24 and 48 students at each age level in the longitudinal cohorts.
Teachers
The six teachers comprised five females (two from school A; three from school B) and one male (school A). Three teachers were originally from Samoa (Teacher 1, Teacher 2 and Teacher 6). The first two teachers had undergone teacher re-training in New Zealand, the other had not. The other three teachers were New Zealand trained (Teacher 3, Teacher 4 and Teacher 5). Half of the teachers were in the 25–35 age range, the other half in the 36–45 range. Teacher qualifications ranged from Diploma in Teaching (with one completing the Bachelor of Education degree), to Bachelor of Education (Teaching), and Bachelor of Teaching and Graduate Diploma in Teaching. Two held English for Students of Other Languages (ESOL) Diplomas.
School reading comprehension lessons
Observations were carried out as part of the intervention (see below), and they provided a general description of the programmes across phases through which the intervention was delivered. Generally the programme was similar across classes and schools, and similar to the general descriptions of the New Zealand teaching in the middle grades (Smith & Elley, 1994; Ministry of Education, 2006). A 10-15 minute whole class activity, which involved mostly introducing and sharing a text, often a narrative text, or reviewing the previous day’s work, was usually followed by a 30-40 minute guided reading session in small groups, led by the teacher using an instructional text. These included text study and analysis (such as study of plot or character in narrative texts and extracting and using information in informational texts), specific group or paired forms of instructional/guided reading (such as ‘reciprocal teaching’), and individual or group project work (such as developing taxonomies of categories introduced in science topics). Typically, the teacher worked with two groups over this time period and held conferences on the run with other groups.
Levels of engagement were generally high, with routines well established and many instances of teacher-student and student-student interactions. The general organisation meant that whole class activities occurred on 3-5 days per week and small group work with one or two groups often daily, so that each group had at least one session but up to three sessions with direct teacher guidance each week. However, the variation in frequency of contact with each group was quite marked between schools. When they were not with the teacher, groups did a range of activities. Some had developed to the point of being able to operate just with peer guidance in reciprocal teaching. In most classrooms, worksheets, sometimes related to the texts, were used; these contained questions about a text and often contained sentence, word or sub word studies.
Design
Rationale for the quasi-experimental design
At the core of the following analyses is a quasi-experimental design from which qualified judgements about possible causal relationships are made. While it has been argued that the gold standard for research into schooling improvement is a full experimental design, preferably involving randomised control and experimental groups over trials (McCall & Green, 2004), a quasi-experimental design was adopted for two major reasons. The first is the inapplicability of a randomised control group design for the particular circumstances of this project. The second is the usefulness of the quasi-experimental design format, given the applied circumstances.
Schools are open and dynamic systems. Day to day events change the properties of teaching and learning and the conditions for teaching and learning effectively. For example, in any one year teachers come and go, principals may change, the formula for funding might be altered, and new curriculum resources can be created. More directly, teachers and schools constantly share ideas, participation in professional conferences and seminars adds to the shared information, and new teachers bring new knowledge and experiences. Such inherent features of schools are compounded when the unit of analysis might be a cluster of schools who deliberately share resources, ideas and practices.
This ‘messiness’ poses tensions in a randomised experimental and control group design. On the one hand, the internal validity need is to control these sources of influence so that unknown effects do not eventuate which may bias or confound the demonstration of experimental effects. On the other hand, if schools are changed to reduce these influences so that, for example, there is no turnover in teaching staff, external validity is severely undermined because these conditions may now not be typical of schools in general.
It is of course possible to conceive of selecting sufficiently large numbers of teachers or schools to randomly assign. Then one assumes that the ‘messiness’ is distributed randomly. If the teachers and the schools in the total set are ‘the same’, then the error variance associated with this messiness is distributed evenly across experimental and control classrooms and schools. Leaving aside the challenges which large numbers of schools pose, a problem here is the assumption that we know what makes teachers and schools similar, and hence are able to be sure about the randomisation process. This is a questionable assumption to make. For example, in the current project the presence of bilingual classrooms in some schools, with different forms of bilingual provision, would create difficulties for random assignment as well as for comparability across teachers, let alone across schools. So what counts as an appropriate control is not necessarily known. There may also not be enough instances of different types of classrooms or schools even to attempt random assignment.
There is another difficulty: that of withholding treatment from the control group of schools. Just about any well resourced, planned intervention is likely to have an effect in education (Hattie, 1999). The act of deliberately withholding treatment, as required in control group designs, raises ethical concerns. Some researcher groups in the United States, also concerned for educational enhancement with schools serving poor and diverse communities, have deliberately adopted alternatives to randomised experimental and control group designs, because of ethical concerns for those settings not gaining access to the intervention (Pogrow, 1998; Taylor et al., 2001). Hattie (1999) proposed that the ethical difficulty could be overcome by comparing different interventions, thus not withholding potential benefits from any group. This is not always a workable solution, for example when the theoretical question is about the effects of a complex multi-component intervention that reformats existing teaching in a curriculum area, such as literacy instruction. Here there is no appropriate alternative intervention other than existing conditions. The American Psychological Association has detailed guidelines for conditions under which withholding treatment is justified. For example, if an intervention is shown to be effective, then it should be implemented in the control group. This route has similarities with the design proposed below.
The most damaging problem, however, is the underlying logic of experimental and control group designs. In these designs, the variation within each group (given the simple case of an experimental and a control group) is conceived as error variance and, when substantially present, is seen as problematic. The alternative design adopted below is based on a view of variability as inherent to human behaviour generally (see Sidman, 1960), and specifically present in applied settings (Risley & Wolf, 1973). It deliberately incorporates variability and the sources of the variability into the design. Questions about the characteristics and sources of variability are central to knowing about effective teaching and learning, and can be explored within the design. Such a design is more appropriate to the circumstances of building effectiveness over a period of time, given that the variability is an important property (Raudenbusch, 2005). Similarly, such designs are useful in the case of planning for sustainability with ongoing partnerships. In fact, longitudinal designs are recommended in which sources of variability are closely monitored and related to achievement data, such as levels of implementation, the establishment of professional learning communities, coherence of programme adherence, and consistency of leadership and programme focus over time (Coburn, 2003). These are all matters of concern in the research reported here.
Repeated measures of children’s achievement were collected in February 2003 (Time 1), November 2003 (Time 2), February 2004 (Time 3), November 2004 (Time 4), February 2005 (Time 5) and November 2005 (Time 6) as part of the quasi-experimental design (Phillips, McNaughton & MacDonald, 2004). One further time (February 2006) was added in the report to add to the evidence of sustained changes. The design uses single case logic within a developmental framework of cross-sectional and longitudinal data. The measures at Time 1 generated a cross section of achievement across year levels (Years 4–8), which provided a baseline forecast of what the expected trajectory of development would be if planned interventions had not occurred (Risley & Wolf, 1973). Successive stages of the intervention could then be compared with the baseline forecast. The first of these planned interventions was the analysis and discussion of data. The second was the development of instructional practices. The third was a phase in which sustainability was promoted. This design, which includes replication across cohorts, provides a high degree of both internal and external validity. The internal validity comes from the in-built testing of treatment effects described further below; the external validity comes from the systematic analysis across schools within the cluster.
The cross sectional baseline was established at Time 1 (February 2003). Students from that initial cross-section were then followed longitudinally and were re-tested at Time 2, 3, 4, 5 and 6, providing repeated measures over three school years. Two sorts of general analyses using repeated measures are possible. Analyses can be conducted within each year. These are essentially pre- and post-measures. But because they are able to be corrected for age through transformation into stanine scores (Elley, 2001), they provide an indicator of the impact of the three phases, against national distributions at similar times of the school year. However, a more robust analysis of relationships with achievement is provided using the repeated measures within the quasiexperimental design format. They show change over repeated intervals.
Good science requires replications (Sidman, 1960). In quasi experimental research, the need to systematically replicate effects and processes is heightened because of the reduced experimental control gained with the design. This need is specifically identified in discussions about alternatives to experimental randomized designs (Borko, 2004; Chatterji, 2005; Raudenbusch, 2005). For example, McCall and Green (2004) argue that in applied developmental contexts, evaluation of programme effects requires a variety of designs, including quasi-experimental, but our knowledge is dependent on systematic across site analyses. Replication across sites can add to our evaluation of programme effects, particularly when it is inappropriate or premature to conduct experimental randomized designs. Such systematic replication is also needed to determine issues of sustainability (Coburn, 2003) and scaling up (McDonald, Keesler, Kauffman, & Schneider, 2006). Coburn argues that the distribution and adoption of an innovation are significant only if its use can be sustained in original and subsequent schools.
In the design used with this cluster of schools, there were in-built replications across age levels and across schools within the quasi-experimental design format. These provide a series of tests of possible causal relationships. However, there are possible competing explanations for the conclusions of the cluster wide results which are difficult to counter with the quasi-experimental design. These are the well known threats to internal validity, two of which are particularly threatening in the design adopted here.
The first is that the immediate historical, cultural and social context for these schools and this particular cluster meant that an unknown combination of factors unique to this cluster and these schools determined the outcomes. Technically, this is partly an issue of ‘ambiguous temporal precedence’, and partly an issue of history and maturation effects (Shadish, Campbell & Cook, 2002). For example, it might be that the nature of students changed in ways that were not captured by the general descriptions of families and students. Or, given that the immediate history included a number of initiatives such as ECPL (Early Childhood Primary Links) and AUSAD (Annan, 1999), the schools were developing more effective ways of teaching anyway.
A second is that the students who are followed longitudinally and were continuously present over several data points were different in achievement terms from those students who were present only in the baseline, and subsequently left. It might be, for example, that the comparison groups contain students who were more transient and had lower achievement scores. Hence over time, as the cohort followed longitudinally is made up of just those students who are continuously and consistently at school, scores rise. Researchers such as Bruno & Isken (1996) report lower levels of achievement for some types of transient students. This is partly an issue of potential selection bias, and partly an issue of attrition (Shaddish et al., 2002). As the projected baseline bases its projections on the assumption that the students at baseline are similar to the cohort students, having a lower projected baseline may result in finding large improvements due to the design of the study, rather than to any real effects.
Other threats to internal validity, such as regression, testing and instrumentation, are handled by other aspects of the methods. For example, all students in all achievement bands were in the cohorts; similarly repeated testing occurred, but with instruments that were designed for the interval of repetition and with alternative forms. But given that there is debate within New Zealand about how influential school-based interventions focused on teaching practices can be in raising achievement (Nash & Prochnow, 2004; Tunmer, Chapman & Prochnow, 2004), and the significance of these counter-arguments to policy directions, it is important to add to the evidence of teacher effectiveness (Alton-Lee, 2003).
There are three ways of adding to the robustness of the design, in addition to the in-built replications, which meet the major threats. The first is to use as a comparison a similar cluster of schools that has not received the intervention. It was possible to identify such a cluster post hoc, and examine the baseline levels in these schools after a year of intervention, to check whether levels in the second cluster had changed significantly. The second cluster was similar in geographical location (neighbouring suburbs), in type (all decile 1 schools), in number of schools (n=7), in number of students (n=1161), in ethnic and gender mix (equal proportions of males and females from over 12 ethnic groups, the major groups being Samoan (37%), Mäori (22%), Cook Island (18%) and Tongan (15%)), in starting levels of achievement, and in prior history of interventions. The second cluster was measured exactly one year after the baseline was established in the first cluster reported here (Lai et al., 2006).
The two baselines are shown in Figures 1 and Figure 2 below. The comparison shows that the second cluster of schools had similar levels of achievement to the first cluster of schools. This was so even though there was a delay of a year and after an intervention had been in place for a year in the first cluster of schools, and, as we report below, achievement levels had risen in those schools. This comparison adds to the design conclusions by establishing that there was no general impact on similar neighbouring area decile 1 schools operating over the time period of the intervention.
Figure 1 Baseline (at Time 1) student achievement for Cluster 1 by year level
Figure 2 Baseline student achievement for Cluster 2 by year level (a second cluster delayed by a year)
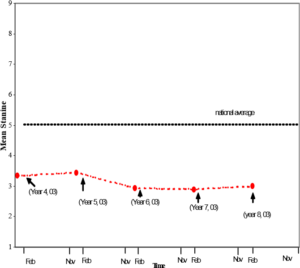 |
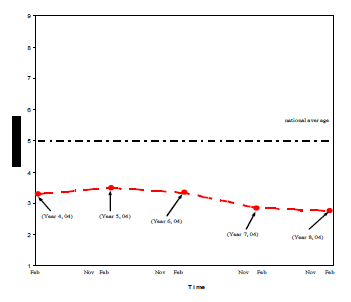 |
A second way of adding to the robustness of the design is by checking the characteristics of students who are included in the cross-sectional analysis, but not included in the longitudinal analysis, because they were not present in subsequent repeated measures. This is done for the first year data by checking the achievement data for those students who were present at two time points (Time 1 and Time 2), versus those students who were present only in the cross-sectional baseline established at Time 1 (Time 1 only). The results of this checking are given in Table 1 for raw scores, and in Table 2 for stanines. The comparisons indicate that in each case, in all but one comparison, the two groups of students were not significantly different.
| Time 1 only (Feb 03) a | Time 1 pre-post (Feb 03) b | ||||||||
|---|---|---|---|---|---|---|---|---|---|
| N | M | SD | N | M | SD | t value | ES | ||
| Year 4 | 34 | 16.26 | 7.57 | 205 | 16.90 | 6.82 | 0.50 | 0.09 | |
| Year 5 | 34 | 18.94 | 9.42 | 208 | 21.96 | 8.13 | 1.96 | 0.34 | |
| Year 6 | 30 | 23.60 | 9.58 | 265 | 24.09 | 8.87 | 0.28 | 0.05 | |
| Year 7 | 33 | 30.61 | 10.70 | 267 | 30.16 | 12.26 | 0.20 | 0.04 | |
| Year 8 | 34 | 32.68 | 13.18 | 271 | 37.41 | 13.11 | 1.99 | * | 0.36 |
a Note: this group contains those students who sat test at Time 1 only
b Note: this group contains those students who sat test at both Time 1 and Time 2
| Time 1 only (Feb 03) a | Time 1 pre-post (Feb 03) b | ||||||||
|---|---|---|---|---|---|---|---|---|---|
| N | M | SD | N | M | SD | t value | ES | ||
| Year 4 | 34 | 3.06 | 1.58 | 205 | 3.27 | 1.32 | 0.85 | 0.14 | |
| Year 5 | 34 | 2.88 | 1.81 | 208 | 3.52 | 1.52 | 2.22 | 0.38 | |
| Year 6 | 30 | 3.07 | 1.55 | 265 | 3.16 | 1.56 | 0.32 | 0.06 | |
| Year 7 | 33 | 2.85 | 1.15 | 267 | 2.84 | 1.31 | 0.56 | 0.01 | |
| Year 8 | 34 | 2.56 | 1.31 | 271 | 2.99 | 1.46 | 1.66 | * | 0.31 |
a Note: this group contains those students who sat test at Time 1 only
b Note: this group contains those students who sat test at both Time 1 and Time 2
These two additional checks add to the robustness of the design by demonstrating that the intervention can not easily be explained as arising from external and general effects on decile 1 schools in these suburbs, or the immediate histories of interventions and resourcing. In addition, they do not support the competing explanation that the students analysed in the longitudinal design were higher achievers anyway, and hence any ‘progress’ is simply their usual levels compared with all other students.
A third way to add to the robustness is provided by analyses which are not part of the design logic. One already mentioned is in the form of pre- and post-testing, using normalized scores. In addition, and as an extension to these analyses, analyses are conducted of the overall student group at each testing time, irrespective of their previous presence or subsequent absence. This allows us to check whether overall achievement levels in schools could be influenced, despite new cohorts of students entering during the three years.
Procedures
Interventions across phases
Phase 1 – Analysis of data, feedback and critical discussion
Current research on learning communities suggests that critical discussion and analysis of data may have an impact on effective practice that is independent of professional development programmes generally (Ball & Cohen, 1999; Timperley, 2003; Toole & Seashore, 2002). Theories about the needs for teaching and learning are developed through critical discussion, which is predicted to strengthen shared understanding and to inform current practices. In the current design we are able to examine the effects of this process prior to the planned second phase of the professional development.
Area-wide data was analysed by the school leaders and researchers in two meetings, then analysed by senior managers and senior teachers with each school using their specific school data. Additional sessions were conducted with support from one of the researchers (Mei Lai). This was the same procedure for the Samoan bilingual classrooms too, with support from another of the research group (Meaola Amituanai-Toloa).
The analysis, feedback and discussion process involved two key steps. Firstly, a close examination of students strengths and weaknesses and of current instruction to understand learning and teaching needs and secondly raising competing theories of the ‘problem’ and evaluating the evidence for these competing theories. This meant using standards of accuracy, coherence and improvability (Robinson & Lai, 2006). This process further ensured that the collaboration was a critical examination of practice and that valid inferences were drawn from the information. The feedback procedures with examples are described fully in Robinson and Lai (2006).
Phase 2 – Targeted professional development
General outline
Targeted professional development which took place in the second year consisted of 10 sessions over two terms, and was designed using research based examples and on known dimensions of effective teaching. The sessions were led by one of the researchers (Stuart McNaughton). Five groups of 10-15 teachers with literacy leaders from different schools attended these half day sessions, which occurred every two weeks from the middle of the first term 2004. The last session was held at the end of the year. The curriculum for the sessions used a mixture of theoretical and research-based ideas, as well as teacher investigation and exemplification from their own classrooms.
Specific sessions
The ten sessions were broken down in the following way. Session one introduced theoretical concepts of comprehension, and related these to the profiles of teaching and learning. A theoretical model was presented, drawing on Sweet and Snow (2003) and developmental analyses such as Whitehurst and Lonegan (2001). A task was set to examine individual classroom profiles of achievement, and how these mirrored or differed from school and cluster patterns. Each session from this point started with group discussion of the task that had been set, and sharing of resources relating to the topic. Session two focused on strategies, in particular the issues of checking for meaning, fixing up threats to meaning, and strategy use in texts. A task to increase the instructional focus on checking and fixing was set. The third session introduced theories and research relating to the role of vocabulary in comprehension. Readings used included Biemiller (1999), Pressley, (2000), and those which identified features of effective teaching of vocabulary. The task for this session was to design a simple study, carried out in the classroom, which looked at building vocabulary through teaching. Sessions four and five identified the significance of the density of instruction and repeated practice, with a particular focus on increasing access to rich texts, including electronic texts (Block & Pressley, 2002). The task mirrored this emphasis, with an analysis by the teacher of the range and types of books available in classrooms, and of engagement by different students. The sixth and seventh sessions introduced concepts of “incorporation” (of cultural and linguistic resources), and building students’ awareness of the requirements of classroom tasks and features of reading comprehension (from McNaughton, 2002). Tasks relating to observing and analysing these features of instructions were set. Sessions eight and nine used transcripts of the video classroom lessons to exemplify patterns of effective teaching in different settings, such as guided reading and shared reading, and developed the practice of examining and critiquing each other’s practices. The ninth session also had some specific topics which the groups had requested, such as the role of homework and teaching and learning in bilingual settings. Session nine also involved planning to create learning circles within schools, where colleagues observed in each other’s classrooms aspects of teaching such as building vocabulary, and discussed what these observations indicated about effectiveness. The final session reviewed these collaborative teaching and learning observations.
Phase 3 – Sustaining the intervention
The third phase was planned by the literacy leaders and researchers jointly. It involved four components. The collection, feedback on and critical discussion of achievement data continued. A second component was the continuation of the learning circles developed in the professional development phase. A third was the development and use of planned inductions into the focus and patterns of teaching and professional learning in the schools. The schools experienced staff turnover of differing degrees, but on average around a third of the staff changed from year to year. This component was designed to maintain and build on the focus with new staff. A fourth component was a teacher led conference. School teams developed action research projects, often with a pre- and post-testing component, to check various aspects of their programmes. The questions for these projects were generated by teams within schools. The researchers helped shape the questions and the processes for answering the questions. Two research meetings took place at each of six schools (the seventh had a change of principal and literacy leader and declined to develop projects, although staff attended the conference). Several of the research topics were about increasing vocabulary, both in language programmes and in instructional reading and writing programmes; others included increasing factual information in narrative writing (to build awareness of use of factual information); teaching of skimming and scanning in the reading programme; instructional strategies to increase the use of complex vocabulary in writing; the effects of using a new assessment tool for writing to inform teaching; redesigning homework to raise literacy levels; and the use of critical thinking programmes. In each case, the projects involved use of formal or informal assessments of student outcomes. A total of 11 projects were presented in power point format at a conference on a Saturday in the fourth term of the school year, attended by 90 percent of the teachers involved. Other professional colleagues, such as literacy advisors, also attended the conference.
Measures
Literacy measures in English
Initially data on reading comprehension were collected, using both the revised Progressive Achievement Tests (PAT) in Reading (reading comprehension section only) (Reid & Elley, 1991), and the Supplementary Tests of Achievement in Reading (STAR) (Elley, 2001). The tests were what schools had decided to use as a group to collect to measure reading comprehension, because they provided a recognised, standardised measure of reading comprehension which could be reliably compared across schools.
The revised PAT in Reading measures both factual and inferential comprehension of prose material in Years 4 to 9. Each prose passage consists of 100-300 words, and is followed by four or five multi-choice options. The prose passages are narrative, expository and descriptive, and different year levels complete different combinations of prose passages. The proportion of factual to inferential items per passage is approximately 50/50 in each year level.
STAR was designed to supplement the assessments that teachers make about students’ ‘close’ reading ability in Years 4 to 9 in New Zealand (Elley, 2001). The rationale behind STAR is the expectation that all students are to learn to read successfully at primary school. In other words, reading successfully at primary school means learning to read appropriate text fluently, independently, and with comprehension. The definition, according to the Literacy Task Force Report (1999), implies that students should also be equipped with reading skills thought to be central to reading programmes at each level of the primary school, although some of them (e.g. critical reading, gathering information) may be given greater emphasis at the upper levels (Elley, 2001).
Analyses over the first year revealed that the correlation between the two tests was .62 (P < .01). In the test manual, Elley (2001) reported correlations between 0.70 and 0.78 for Year 4 to 8 students. This, as Elley suggests, indicates that the tests measure similar but not identical facets of reading comprehension. Subsequently, schools focused on using the STAR data. The outcome data on reading comprehension reported here for the overall project are from across the six time points using STAR (Elley, 2001). These tests were designed for repeated measurement within and across years, are used by schools, and provide a recognised, standardised measure of reading comprehension which can be reliably compared across schools. In addition to these assessments, the schools used other reading measures for both diagnostic and summative purposes, and the baseline results for these are reported elsewhere (McNaughton et al., 2004).
STAR Sub-tests – Years 4–6
In Years 4–6, the STAR test consists of four sub-tests measuring word recognition (decode familiar words through identifying a word from a set of words that describe a familiar picture); sentence comprehension (complete sentences by selecting appropriate words); paragraph comprehension (replace words which have been deleted from the text in a Cloze format); and vocabulary range (find a simile for an underlined word). Only the paragraph comprehension subtest is not multi choice and consists of 20 items. 10 more than the rest of the sub-tests. In Years 7–8, students complete two more sub-tests in addition to the four sub-tests described above; the language of advertising (identify emotive words from a series of sentences); and reading different genres or styles of writing (select phrases in paragraphs of different genres which best fits the purpose and style of the writer). In Years 7–8, there are 12 items per sub-test, except for paragraph comprehension, which consists of 20 items. Both tests have high reliability and validity (Elley, 2001; Reid & Elley, 1991).
Sub-test 1: Word recognition
Word recognition assesses how well students can “decode words that are familiar in their spoken vocabulary” (e.g., umbrella, dinosaur, cemetery…). The test measures word recognition in the form of decoding of familiar words, through identification of a word from a set of words that describe a familiar picture. Ten pictures that are assumed to be familiar to students are in the subtest. Each picture has four words alongside it, one of which is the correct one. Students are asked to select the correct word that matches the picture. The words tested in STAR Test 4–6 are taken from Levels 6–8 of the NZCER Noun Frequency List (Elley & Croft, 1989), and are thus well within the range of most pupils’ spoken vocabulary. Evidence shows that, for the majority of pupils in the upper levels of the primary school in New Zealand, word recognition is a skill that has been well mastered, but many schools have a few pupils who will struggle with this task.
Sub-test 2: Sentence comprehension
Sentence comprehension assesses how well students can read for meaning. The prerequisite for this sub-test is that students are able to read a range of very short texts (sentences) well enough to complete them with an appropriate word. Students are to complete the 10 sentences by choosing, from four words, the word that best suits the sentence. This test assesses decoding skills, and the ability to use a range of sources to gain meaning. To some extent, it also reflects students’ mastery of the concepts of print, their vocabulary, and their ability to predict.
Sub-test 3: Paragraph comprehension
Paragraph comprehension assesses students’ reading comprehension by requiring them to replace words which have been deleted from the text (Cloze format). Using the context of the text as cues to meaning, students can find it easier to replace the missing words, given that they can comprehend the text. The sub-test shows how well pupils can apply the skills tested in sub-test 2 to longer texts, when more linguistic and knowledge cues can be called on from previous sentences. Unlike sub-tests 1 and 2, this test is not multi-choice. It does, however, consist of 20 items, 10 more than the other sub-tests. The students are required to fill in 20 blanks in three short paragraphs of prose (paragraph 1 = 6; 2 = 7; 3 = 7), using the context of the surrounding text as cues for meaning to assess skills.
Sub-test 4: Vocabulary range
The development of a good reading vocabulary is the main focus of this test, because it measures students’ knowledge of word meanings in context. Ten complete sentences are listed. One word in each sentence is in bold print and underlined. The students are required to circle one word from the four words under the sentence that means the same, or nearly the same, and is therefore close in meaning to the bold underlined word. The words included in this test are all taken from the New Zealand Oxford Primary School Dictionary of 30,000 words, and were selected after extensive trials had shown them to be of appropriate difficulty for the students in the relevant year groups.
STAR sub-tests – Years 7–9
In Years 7–9, students complete two more sub-tests in addition to the four sub-tests described above. These sub-tests are on the language of advertising (identify emotive words from a series of sentences) and reading different genres or styles of writing (select phrases in paragraphs of different genres which best fit the purpose and style of the writer). In Years 7–9, there are 12 items per sub-test, except for paragraph comprehension, which consists of 20 items. Both tests have high reliability and validity (Elley, 2001; Reid & Elley, 1991).
Sub-test 5: The language of advertising
This sub-test requires the students to identify emotive words which are typically used by advertisers when trying to attract consumers to buy. Students read a series of sentences and circle the one word that sounds appealing, but provides no information, e.g. “fabulous”, “gotta-go”, “cosy”. This skill is part of learning to be a critical reader, and is stressed in “English in the New Zealand Curriculum” for Years 7 and 8 (or Curriculum Levels 4 and 5).
Sub-test 6: Reading different genres or styles of writing
Pupils in the senior levels of primary school are expected to read with understanding various styles or genres of writing, both formal and informal. To assess this skill, pupils are given some paragraphs which represent a range of genres, and at particular points in each paragraph, they are asked to select the phrases which best fit the style and purpose of the writer. The genres represented include traditional fairy tales, business letters, informal letters, recipes, and computer manuals.
Reliability of STAR assessment
At the beginning of 2003, the Senior Assessment Team (SAT) developed an intra-school standardised process of administering the test and moderating the accuracy of teacher scoring. This involved standardising the week and time (morning) of testing, and creating a system of randomly checking a sample of teachers’ marking for accuracy of scoring. Accuracy of scoring was further checked by the data entry team from Woolf Fisher Research Centre during data entry and during analysis. The STAR and PAT were administered as part of schools’ normal assessment cycle at the beginning of the school year, and thereafter for STAR at the end of each year also (using the parallel form). At Time 1 (February 2003), a number of additional analyses took place. These involved analysing student scores on factual and inferential questions in the PAT, and analysing sub-test scores in STAR. In STAR, this also included qualitatively coding the types of errors students made on the Cloze passage, according to the types of errors reported in the STAR manual (Elley, 2001). Four raters were trained to code errors. These raters subsequently discussed how to code the errors, and collectively rated a sample of tests to determine reliability of coding. The coding was subsequently checked and inter-observer agreement on 10 percent of students’ sub-tests (across ages) was 90.5 percent.
Observations
Evidence about current classroom instruction came from systematic classroom observations carried out by the researchers. These were designed to provide a sample of how features of teaching and learning might map on to the achievement data. Our argument was that a fully effective teaching analysis needed to examine classroom instruction, otherwise assumptions about what was or was not being taught would be unchecked.
Observations at baseline (first year)
Phase 1 observations were carried out in 16 classrooms in seven schools from Years 4–5 through to Year 8 (including one bilingual Samoan classroom), selected to represent all schools and age levels within schools. In the second term, classroom instruction was observed for 40–60 minutes during the usually scheduled core reading session within which the teaching and learning of reading comprehension occurred. Class sizes generally ranged from 21–26. A combination of diary and audio recording of specific activities occurred. Discussions with teachers also provided an important level of professional reflection.
Observations at Time 3 and Time 4 (second year)
At the beginning of the second year (February 2004), 15 classrooms (including the six Samoan bilingual classrooms in two schools) were systematically observed; again, classrooms were nominated and selected to represent age levels. Video recordings were made of teacher-student and text interactions during the usually scheduled core reading session for comprehension. All of the whole group and at least one small group activity was recorded. The amount of time allocated to reading on a typical day ranged from 30 to 60 minutes (average 38.6 minutes, SD = 11.9 minutes). The observations were repeated at the end of the year (November) with 12 teachers, 9 of whom were videotaped at the beginning of the year, and were still teaching and available for a second videotaping. Discussions with the teacher were held again, and the observers also made notes on features of the general classroom programme.
Coding and reliability of observations
Systematic classroom observations of core literacy activities were coded, using the coding handbook developed by the research team.
Exchanges
Exchanges were the basic unit of analysis of the videotapes. An exchange was initiated by an utterance followed by a set of interactions on the same topic, involving comments, questions, directions, explanations or feedback between teacher/child or child/group. A minimal exchange would be one turn by a teacher or student. A change in topic during interactions, a return to text reading, or a new activity signalled the end of an exchange. Each exchange was coded as a specific type, using the following definitions:
- text-related;
- non-text-related;
- vocabulary elaboration;
- extended talk;
- checking and evaluating;
- incorporation;
- awareness;
- feedback.
Text-related exchanges and non-text-related exchanges (TR and NTR)
Text-related exchanges were exchanges that dealt specifically with the text at hand. Any comment or question related to the text came under this category. Non-text-related exchanges, on the other hand, were exchanges that were not related to the text, but were employed nevertheless to prompt students to answer comprehension questions that were otherwise difficult to respond to. An example of text-related-exchange:
| T: | What is the moonlight? If you know anything, don’t shout “I know” O le fesili la [The question is] “What is the moonlight? The next question will go to M. What is the moonlight. Ua na’o lo’u fia moe a… [I just wanna go sleep …] | |
| C: | (No response but child 1 interrupted) | |
| C: | A big circle in the air (laughter) | |
| T: | A big circle in the air is a bit …good imaginative … | |
| C: | Circle is shining… (one child says) the light’s shining down (another child says) shining (another child says) the light’s far away and it shines like a little but it’s real and it’s shining. | |
| T: | E sau mai fea le moonlight? O le a le fa’asamoa o le moonlight? [Where does the moonlight originate from? What is Samoan for ‘moonlight’?] | |
| C: | Masina [Moon] | |
| T” | O le masina [The moon]. O le masina e susulu i luga i o i le night time [The moon shines up there at]. O fea le mea e sau ai le masina? [Where does the moon come from?] | |
| C: | I le lagi [From the sky] | |
| T: | I fea? [Where?] | |
| C: | I le space [In space] | |
| T: | I le space [In space]. Manaia [Nice]. | |
| C: | Mai Pluto [From Pluto]. E shine le la i le moon ae reflect mai i [The sun shines on the moon and it reflects it]. | |
| T: | E scientific a? [It’s scientific isn’t it?] Lelei tele R [R is good]. |
(Teacher 4 Time 3)
Vocabulary elaboration
Exchanges that elaborated vocabulary in the text were coded into three (non-mutually exclusive) types. These were questions seeking elaboration (VEQ), elaboration of vocabulary by the teacher (VECT) and elaboration by looking up meanings in the dictionary (VECD). An example of vocabulary elaboration question and teacher comment:
Text word: catch
| T: | (reading) “They were always good friends and always share their catch” What do you mean by that? “Share their own catch”, can you say it in other words? | |
| C: | Divide them and halving each other | |
| T: | Divide them – good | |
| C: | When they get fish they share it | |
| T: | When they get fish they always share their … | |
| C: | Catch |
And an example of teacher comment:
| T: | Or half the fish … What does it mean by the word “catch”? This time how is the word “catch” used in the story? We know that catch is a … what form of word? | |
| C: | A verb | |
| T: | A verb. Always we use ‘catch’ as a verb but this time it is used as a…? | |
| C: | (two students answer together). A noun | |
| T: | A noun. Very good. How do you describe it in your own words? What does it mean by catch this time? Because you say we use catch as a verb but this time it is used as a noun – so what are they? | |
| C: | Fish | |
| T: | Fish they …. | |
| C: | Catch | |
| C: | Catch and eats | |
| T: | Very good. The catch this time are the … | |
| All: | The fish | |
| T: | Refer to the … | |
| All: | Fish |
(both examples above from Teacher 1 Time 3)
Extended talk
Extended talk meant conversations sustained over several turns on a topic that allowed the teacher or child to develop further features of place, time, theme and concept. Exchanges that were limited to a synonym or brief comment on a word or phrase were not coded as extended talk. There were two types: extended talk by teacher (ETT), and extended talk by child or students (ETC). An example of extended talk:
| T: | Carry on (to one of them to read). “Finally mum …” | |
| All: | (some read together) | |
| T: | What feeling is showed or revealed in that paragraph? | |
| C13: | Anger | |
| T: | Do you think it’s anger? Why? Where does it say in the book? | |
| C14: | (read the sentence in the text) T: So who is angry here? | |
| All: | Mum | |
| T: | Why is she angry? | |
| C15: | Because she wouldn’t eat the porridge. | |
| T: | Because who wouldn’t eat the porridge? | |
| All: | Anna | |
| T: | What about Anna, how does she feel? What is the feeling revealed by the word “yukky”? | |
| C16: | Disgusted. | |
| T: | Disgusted. Very good word. Say that word. | |
| All: | Disgusted (again) Disgusted. | |
| T: | What does disgusted mean? | |
| C17: | Something that is gross. | |
| T: | Something that is? | |
| C17: | Gross. Not nice. | |
| T: | Not nice – yes. What about the word “dislike”, do you think it’s similar to disgusted? | |
| All: | Yes |
(Teacher 6 Time 3)
Checking and evaluating
These are exchanges in which there is some explicit reference to checking and evaluating evidence. The reference could involve questions, directions, prompts, feedback or comments. It can be initiated by the teacher, a child or a group and involve the teacher, the child or a group. Three sub-categories were noted. Teacher checking (TC) is where the teacher makes reference to students to check the correctness of their responses by going back to the text to search for confirmations. Child checking (CC) is where the child checks the validity of the responses by verbalising what is found after the teacher prompts. The final subcategory involves the teacher and child checking (TCC) for the evidence together. An example of checking and evaluating:
| All: | (reading the question on the board). What is the ceremony called in Niue? | |
| C: | The hair cutting ceremony | |
| T: | Where do you get that answer | |
| C: | From the heading | |
| T: | Good, do you agree with that? | |
| All: | Yes |
(Teacher 6 Time 3)
Incorporation
Incorporation means exchanges in which students’ knowledge, skills and other expertise are brought into an activity. It is a deliberate attempt by the teacher to make direct links between the text being read and the experiences of the student, through frequency of overt connection with topic events, and concepts that are familiar to the child—for example, when a child is prompted to talk about feelings, references to past events or activities, or being involved in the story. Furthermore, incorporation is also when the language of the child is incorporated. An example of incorporation:
| T: | The “Bush Supermarket” Do we have a bush supermarket in Mangere? | |
| C: | Yeah | |
| T: | Where? | |
| C: | Yeah, you know … (child was about to show where it is) | |
| C: | No. That’s not the bush | |
| T: | Do we have a bush supermarket in Mangere? | |
| All: | No (and others shook heads) | |
| T: | So why do you think it’s called the “Bush Supermarket”? | |
| C: | Cos birds go there | |
| T: | All birds go where? … to the supermarket? | |
| All: | To the bush | |
| T: | Alright. Good that sounds like a good idea. |
(Teacher 3 Time 3)
Awareness
Awareness means exchanges that focus on the child’s awareness through teacher comments, questions, explanations or feedback which explicitly draws attention to the relevance of the child’s knowledge or reflection on knowledge, to the rules of participating, and to the purpose or ways of participating. The two types were awareness of strategy (AS), such as clarifying, predicting and summarising, and awareness of any other aspect of the task or child’s expertise (AVE). An example of awareness (AS):
| T: | First thing we need to do before we move on to the story is we need to know what the four strategies are for reciprocal reading. | |
| C: | Clarifying? | |
| T: | Clarifying | |
| C: | Questioning? | |
| T: | Questioning | |
| C: | Summarising | |
| T: | Summarising. Manaia. (Nice) |
(Teacher 4 Time 3)
Feedback
Feedback is defined as teacher responses reliant on a student action or verbal contribution. Of the two subcategories, high feedback (FH) is any feedback that clarifies, elaborates on, or adds to the student’s statement or response. It includes teacher correction of a student’s incorrect answer or statement, or teacher response to a student’s utterance with a question. Low feedback (FL) is nondescriptive and provides no extra information for the student, other than correctness. An example of high feedback:
| T: | Tells us what the main points. Tells us what is gonna happen. That’s why when you see the movies … Who’s been to the movies? Ok hands down. They either have those brief (I’ve forgotten the name now) you know there’s a movie that’s coming out and they show you just a little bit about the movie. Sometimes it’s like “Oh yeah. I wanna see that!” Don’t know if you call it commercials. Maybe that’s your job tonight. Go home and find out what it’s called. Now don’t you just … I think it’s ‘trailer’. Just a brief description to show you what the movie is gonna be about. It’s just like the book. Just a brief description of what the story is about. (Bell went untimely – not fire but photographs). | |
| As you’re reading there are three things I’d like you to look at. Just go through and have a look for these three things I’m gonna … (writes the words on the board) “phrase”, “metaphor”, “simile” before we even look in our dictionaries to see what they mean, what is a phrase? Everyone’s ready to look but I want you to think. Can you predict? What is a phrase? |
(Teacher 5 Time 3)
Development of the definitions and codes took place over several sessions in which three transcripts were randomly selected and coded by different members of the research team, until there was close to 100 percent agreement on the basic unit and on types of exchanges (all members of the team had to concur on presence or absence for an agreement to be scored). Subsequently, a further transcript was coded by each member independently, and the interobserver agreement calculated by the presence and absence of types of exchanges. The levels of inter-observer agreement ranged from 86 percent for the awareness categories to 100 percent on the text-related or non-text-related categories. One member of the team coded all observational data (including the Samoan bilingual data) used for the analyses presented here.
Data analysis
Reading comprehension achievement
The data were analysed in terms of patterns of achievement, using repeated measures and gain scores, as well as raw score shifts. In addition to the use of raw scores on subtests and stanines, the analysis of achievement patterns for the STAR assessments used distribution bands. The manual (Elley, 2001) groups stanines into 5 bands; stanine 9 (outstanding, 4 percent of students); stanine 7–8 (above average, 19 percent of students); stanine 4–6 (average, 54 percent of students); stanine 2–3 (below average, 19 percent of students; stanine 1 (low, 4 percent of students). These bands were used to judge educational significance. SPSS and Excel programmes were used to create a database where data from all testing periods could be recorded and analysed.
Testing the effectiveness of the interventions proceeded in a number of steps, using tests of statistical and educational significance. We compared means and distributions for the children in terms of both pre- and post-testing, and in terms of comparisons using the projected baselines. These comparisons use standard statistical procedures, such as t-tests. Two further steps determined the educational significance of the interventions. The first was based on an assessment of effect size of the educational intervention. Effect size (ES) is a name given to a family of indices that measure the magnitude of a treatment effect. Hattie (1999) describes a 1.0 effect size as an increase of one standard deviation, which usually represents advancing student achievement by about one year. To measure the magnitude of a treatment of effect in this study, Effect Size Cohen’s D was employed (Cohen, 1988).
A second means of judging educational significance uses the idea of risk. This represents the relative increase or decrease in the risk associated with literacy instruction in the decile 1 schools, compared with nationally expected outcomes (see Phillips, et al., 2001). In the present case, we analysed the relative risk of not being at national expectations at the beginning and the end of the three year study, using both longitudinal and total groups. A risk ratio represents the relative increase or decrease in the probability of a given outcome when one rather than another condition is obtained. In this case, the given outcome is expected progress in a range of literacy measures, as determined by the stanines. Following this analysis, Chi square comparisons of obtained frequencies of students’ in stanine bands were compared with expected frequencies in these stanine bands, using X² one sample case comparisons (Siegel, 1956).
Instruction
Two levels of analysis were carried out from the classroom observations. The first level was analysing changes in overall achievement and the text components from the pre- and post-testing, with changes in the categories of teacher instruction from the observations in the middle of the first year, and at the beginning and end of the second year. A second level involved both quantitative and qualitative analyses of two selected case studies of teachers from the second year. This enabled us to go beyond the frequency counts, using the transcript data and classroom records, to better understand the relationships with achievement and variability in achievement across classrooms.
Samoan bilingual study: three approaches to analysing teacher effectiveness
Three approaches to evaluating the effectiveness of teaching in the Samoan bilingual classrooms were developed. The first approach used the quasi-experimental design to demonstrate effects of the teaching, compared with baseline forecasts (Phillips et al., 2004).
The second approach to analysing effectiveness used the total group of students in the classrooms in the two different years. This approach examined teachers’ teaching with new combinations of students entering the classrooms in the second year. Essentially, this covers the dimension of effectiveness that has to do with sustainability (Coburn, 2003).
The third approach examined the outcomes of teaching Samoan students in bilingual classrooms, compared with teaching Samoan students in mainstream classrooms. This is essentially a comparison using the instructional context as the basis of comparison. All the teachers went through the professional development (although there were some variations in attendance, as noted below).
3. Results
Phase 1: baseline profile
The baseline (Time 1) results are presented in four sections: These focus on the general profile of reading comprehension, a content analysis of PAT and STAR, and gender and ethnic group breakdowns.
Achievement profile: general profile of reading comprehension
The stanine distributions of both tests, STAR and PAT, indicate that the average student experienced difficulty on these measures of reading comprehension. Figure 3 shows the stanine distribution in both tests across all year levels. The average student in both tests scored in the “below average” (stanine 2–3) band of achievement. For both PAT and STAR, the mean stanine was 3.1 (in the below average band), with over 60 percent of students scoring in the “low” (stanine 1) or “below average” (stanines 2–3) bands, compared with an expected percentage of 23 percent. Just over one third of students were in the “average” band (stanines 4–6), and less than 5 percent were in the “above average” or “superior” band (whereas 23 percent of students would usually be expected to be in these bands).
Figure 3 PAT and STAR stanine distribution across all year levels
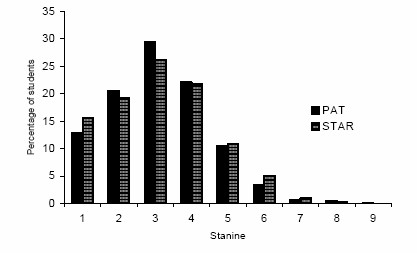
Across the year levels, as Figure 3 shows, the pattern was the same in both tests, with the median in every year level at stanine 3. This is displayed graphically in Figures 4 and 5, in box and whisker plots. The range of achievement was large, from stanine 1 to 9 in the PAT and 1 to 8 in STAR. The relatively flat line in stanines across year levels indicates that under initial instructional conditions, children made about a year’s gain for each year at school, remaining at two stanines below national average across years.
Figure 4 Stanine distribution for PAT in Years 4–8
Figure 5 Stanine distribution for STAR in Years 4–8
PAT content analysis
The pattern of mean scores on factual and inferential questions on the PAT was very similar across all year levels (see Table 3). The maximum raw score for both factual items and inferential items was approximately 20 (Reid & Elley, 1991). This pattern suggests that students at different year levels experienced similar difficulties in answering factual and inferential items. This pattern is to be expected, as Elley (personal communication, October 22, 2004) reports that the pattern of achievement for the two types of questions is expected to be very similar in a large sample, although factual questions are assumed to be easier than inferential ones. (In the present study, there was a significant correlation between factual and inferential items (r = 0.61, p < .01)). However, in the present study, results for inferential questions were higher than for factual ones in some year levels, suggesting that the students in the sample have been instructed or have learned in some systematically different way from the majority mainstream approach (Elley, 2005).
| Year level | N | Factual questions | Inferential questions |
|---|---|---|---|
| 4 | 245 | 4.93 (2.80) |
4.18 (2.36) |
| 5 | 298 | 5.76 3.32 |
4.64 (2.76) |
| 6 | 319 | 5.75 (3.04) |
5.85 (2.76) |
| 7 | 390 | 6.14 (2.82) |
6.31 (2.67) |
| 8 | 471 | 6.41 (3.10) |
6.30 (3.12) |
| 9 | 144 | 6.57 (3.30) |
5.92 (2.51) |
| Total | 1867 | 5.96 (3.08) |
5.65 (2.90) |
Content analysis on the STAR sub-tests
Analysis of the STAR sub-tests revealed consistent patterns across the sub-tests at each year level. Figures 6 and 7 show the average percentage obtained in each sub-test. At every year level, students scored highest on sub-test 1 (Word recognition) and lowest on sub-test 3 (paragraph comprehension), indicating that students in all year levels experienced more success in decoding words than in comprehending a paragraph. All the sub-tests of STAR were significantly correlated (p < .01). The sub-test results can be compared with percentages generated from national norms (see Table 4). A similar pattern of results can be seen in the percentages from the national norms.
Figure 6 Average percentages obtained in each sub-test (STAR) for Years 4–6
Figure 7 Average percentage obtained in each subtest (STAR) for Years 7–8
| Year Level | Subtest 1 | Subtest 2 | Subtest 3 | Subtest 4 | Subtest 5 | Subtest 6 |
|---|---|---|---|---|---|---|
| 4 | 83 | 61 | 50.5 | 50 | ||
| 5 | 87 | 70 | 60 | 58 | ||
| 6 | 91 | 79 | 69.5 | 67 | ||
| 7 | 75 | 58.3 | 56 | 60 | 61.7 | 59.2 |
| 8 | 83.3 | 66.7 | 64.5 | 69.2 | 67.5 | 63.3 |
A series of paired t tests between sub-tests averaged across years revealed that at both age groupings, the means for sub-test 1 were significantly higher than the means for the other sub-tests (t values > 18.0; p < .001). Sub-test 3 means were significantly lower than those for each of the other sub-tests (t values > 12.0, p< .001). In addition, in Years 4–6, all sub-tests were significantly different from each other. In the older age group (Year 7 and Year 8), sub-tests 2 and 5, 2 and 6, and 5 and 6 were not significantly different (p > .05).
Error analysis of STAR sub-test 3 (paragraph comprehension – Cloze)
Errors on sub-test 3 (paragraph comprehension) were analysed according to the coding in the STAR manual, based on common errors made by students, such as “irregular plurals” and “tense problems”. However, nearly half (46 percent) of all possible errors across all year levels did not fit any of these categories. These errors appeared to be of two new types. One involved mistakes that sometimes made sense in the pre-sentence context, but resulted in nonsense or illogical sentences. The following examples show student responses in italics, and the correct response/s in brackets):
All they did (could) afford was a tiny room in a shoe (cottage/house/shop) in a village by a river.
He grabbed frantically, and felt his head (hand(s)/finger(s)) closing around the branch of a tree.
Suddenly, round a sharp bend in the head (road/path/track), he fell again, missed his self (footing/step) and plunged over the ugly (cliff/rock) face.
There were a few instances of a second type of error, where relatively close synonyms, not listed by the manual, were used:
It browses entirely on tall branches (trees/plants) especially the foliage of mimosa and acacia trees.
Ethnicity and gender
Analyses were also conducted by ethnicity and gender. For the PAT, the pattern of achievement was consistent across the major ethnic groups. The median stanine was 3, with half of the students scoring between stanine 2 and 4. In the STAR test, however, the pattern of scores differed slightly between NZ European students and students from the other ethnic groups. The median for NZ European students was stanine 4; the median for the other ethnic groups was stanine 3. The pattern of scores on STAR and PAT was also different for NZ European students, who in general obtained higher stanines in STAR. There were few gender differences between males and females in both PAT and STAR. The median for both males and females was stanine 3, with half the students falling between stanine 2 and 4.
Classroom instruction profile
At the beginning of the research programme, classroom instruction was viewed as an open problem, the critical aspects of which needed to be understood. Thus, while general principles informed what was to be observed, a predetermined category system was not used, and specific aspects of the resulting profile were developed in situ, in the form of hypotheses. In essence the approach had a relatively open-ended investigative purpose, but was theory driven. Some aspects, such as the needs for vocabulary instruction and the use of checking evidence, became working hypotheses from the first set of observations. Hence some limited quantitative estimates are possible, providing limited comparisons with the later systematic recording and analyses in the second year. The resulting instructional focus can be summarised as falling into four areas.
Vocabulary instruction
Across all classes, teachers were observed to identify and elaborate potentially new or unfamiliar vocabulary in both informational and narrative texts. Examples included topic-related words, such as ‘kelp’, as well as common and uncommon English words, such as ‘mysterious’ and ‘clairvoyant’. There were also instances where words in Mäori or a Pasifika language occurred in texts, such as ‘kete’ (Mäori word for flax kit). Less frequently, phrases and idiomatic or figurative uses of language were identified, such as ‘full of beans’ and ‘the sky boiled’.
Many of the instances of vocabulary interactions (estimated from the records to be around 50 percent) involved referring to and defining technical terms. Terms were used for linguistic categories at sub-word, word, sentence, paragraph and text levels. These exchanges often were associated with the teaching of strategies (see below) and the use of technical terms, such as ‘clarifying’, ‘predicting’, and ‘visualising’.
Estimates from the field notes suggested that 6–7 such instances, where the meaning of vocabulary (including technical terms) was specifically identified or elaborated on, occurred on average across the classrooms. This rate, together with other aspects of the verbatim records, suggested two issues. One was that the rate of these interactions occurring for any individual child may have been lower than what was needed. This hypothesis is suggested by a classroom record in which 25 interactions occurred in the course of a 20 minute session, averaging 1 interaction per student. The focus on any one particular word occurred once, and there was little evidence of repeated opportunities to use or elaborate. When asked, the teachers consistently identified vocabulary limits as constraining children’s comprehension.
The second issue, which became obvious in the observations of strategy teaching, was that meanings were seldom checked in ways that elaborated specific connotations in context. Many of the instances involved discussion of students’ ideas about meanings, often with the teacher accepting student contributions without critical appraisal. Few of the instances involved explicit instruction and modelling of how to check meanings within texts, or via a dictionary or a thesaurus (see below).
These issues were fed back to the lead teachers, who discussed them with their teachers in the form of a specific hypothesis that there was a need to increase the rate of vocabulary acquisition, especially non-technical language, and to do so in ways that gave access to multiple meanings and connotations. Research evidence to support the need to boost vocabulary through teacher guidance in elaborations and feedback (e.g., Biemiller, 2001) was identified during this process. Possible ways that were discussed included increased use of reading to small groups with carefully selected texts which provided variation in genre and topic, with planned rates of exposure to new vocabulary. In addition, language acquisition research, which noted how increased extended talk was associated with new vocabulary and with greater understanding of complex utterances, was introduced (e.g., Hart & Risley, 1995). Other strategies included increasing the actual time spent reading, either in groups or individually, because the records indicated a large amount of teacher discussion outside of texts.
Strategies supported by checking and evaluating threats to meaning
The deliberate reference to, teaching of and use of comprehension strategies was present in all classrooms. Specific use of some form of Reciprocal Teaching (Brown, 1997) was directly observed in four schools, and all schools reported some use of specific strategy instruction.
One issue with strategy instruction was suggested very early on in the observations. This was the limited use of text evidence to detect confusions or threats to meaning, or to check and corroborate meanings, and it was observed generally in strategy instruction. Additionally, it was observed as a limitation with vocabulary instruction (as noted above) and in the examples of incorporation (see below). There were few instances where the children were asked to provide evidence for their analyses, comments or elaborations (such as “How did you know?”).
This limited reference to texts to check understanding was especially noticeable with the use of predicting in the whole class and small group activities in which a text was shared, or introduced for some form of guided reading. In every such activity observed, ideas were generated with high engagement. However, explicit direction to check the evidence, in order to see if what was predicted was in fact supported in upcoming text (at sentence, between sentence and text levels), happened infrequently. There were only nine instances in the verbatim record in 16 hours. Across all classes, in all activities, predictions were often prompted, for word meanings, and for event outcomes and sequences, and without exception were accepted and supported (“Good prediction”, “That was clever”, “Could be”). Most of the dialogue observed was about generating ideas, not checking them, and the teachers’ responses were to accept and reinforce predicting. Similarly, asking for predictions often led to exchanges in which the students tried to figure out what the teacher was thinking about, rather than what evidence the text provided.
The hypothesis fed back to the teachers was that comprehension would be enhanced with more direct and explicit instruction and modelling of checking for evidence—for inferences, for meanings of words, for coherence, and so on—within sentences, between sentences, within a text and even across texts. There is some research evidence that this could be a problem in strategy instruction, leading to formulaic use of strategies in general, and to guessing, rather than to the appropriate use of texts to support inferences, to clarify meanings, to maintain coherence and to predict (Baker, 2002). Similarly, recent research reports have identified groups of children who have fast efficient decoding but low comprehension, and who thus have a high rate of errors termed ‘excessive elaborations’, which are essentially guesses (Dewitz & Dewitz, 2003).
Increased incorporation and awareness
Two complementary processes have been proposed as particularly important in effective teaching with culturally and linguistically diverse students (McNaughton, 2002). One of these is the use of students’ expertise in classroom activities. At one level, this involves capitalising on their event knowledge and interests through instruction, including the selection and matching of texts. At other more complex levels, this involves using familiar language forms, and even types of culturally based forms of teaching and learning. But complementing this process is instruction that increases students’ awareness of the relevance of their skills and knowledge and relationships to the goals and formats of classroom activities.
In each of these classrooms, there were instances where teachers incorporated their students’ event knowledge and language skills, drawing on their social and cultural identities. Examples included selection of texts with familiar sports topics, as well as local cultural events, such as formal ceremonies. More complex instances included close reading of local rap songs. In each of the recorded instances, there was a high degree of engagement and interest signalled by the complexity and appropriateness of students’ comments, and this was verified in incidental discussion with the children. However, the need to use more resources for children from different Pasifika communities and Mäori communities was mentioned by several teachers.
The complementary dimension, building the learner’s awareness in classroom activities, was more problematic. Several examples occurred in the observations of children where they did not know exactly what the task was that they were required to perform. To different degrees, these could be a vocabulary problem, or a grammatical complexity problem, or a problem of knowing what the tasks might fully entail. For example, in one classroom, a small group worked on extracting information on natural and artificial sources of light from a text on ‘Sources of light’. Incidental discussion revealed that each student in the group had little or only limited understanding of what ‘source’ meant. In another class, a group who was given the task ‘Find the word in the story so you can give the appropriate meaning’ were found to be unsure about what ‘appropriate’ definitions were. Associated with this was a relatively low rate of explaining (or checking) purposes.
The feedback with teachers focussed on the hypothesis that students’ learning would be improved if instruction enhanced students’ awareness of classroom goals and formats, and their knowledge and skills in relationship to these. Vehicles for this might include the information provided in contingent feedback, as well the setting of clear and consistent learning intentions (Hattie, 1999).
Increased exposure to texts and planned variation across texts
An instructional dimension common to each of the previous areas is the extent of practice within texts and planned variation in exposure across types of texts. Texts for topic study, and specifically for reading comprehension, were generally available in classrooms, but there were extremes. One classroom was filled with topic related texts of different genres. It was noticeable that the children were very familiar with selecting texts to extend current reading, and took home these texts. In one of the most engaged classrooms, something like a ‘book flood’ (Elley, 1991) operated. There were large numbers of resources for topics and for extended or extra reading. Special attention to the availability of texts for boys was a feature. Homework was used as a vehicle to increase the amount of reading in several classes. But these were exceptional, and teachers often commented on the need for the children to have exposure to a greater range of texts, both within classrooms and at home.
Other issues related to exposure to texts were observed at the level of classroom discourse. A common feature across classrooms was questioning in which the teacher tried to elicit a correct answer, but the interactions proceeded over several turns, and took on the feature of trying to guess what was in the teacher’s mind. In one Year 7/8 class, the teacher held a mini lesson on plurals and tense markers. The questioning about what you put ‘ing’ on went on for six questions before the teacher answered her own question.
The research evidence suggests that instruction for minority students may inadvertently reduce their engagement in cognitively complex tasks, and tasks that are critical to the long term development of reading comprehension (e.g., McNaughton, 2002). The identified risks therefore are around limited practice. The hypothesis developed with the teachers was that in each of the areas of concern, instructional ‘density’ could be increased. Testing this hypothesis would require attention to the general textual resources in classrooms, including electronic and internet based resources, to the link between home and schools, and to discourse features which increased rather than reduced engagement in text reading.
A critical feature of the focus in each area was the assumption that the general instructional approaches, such as guided reading and strategy instruction, would provide a platform for more effective instruction, which could be achieved by fine tuning specific aspects.
The observation records and teacher reflections were used, together with the achievement data, to develop a set of possible directions for increasing instructional effectiveness. In essence, these were emerging hypotheses about how instruction might be formatted to be more effective for reading comprehension. The hypotheses were about more effective instruction.
A major alternative hypothesis to those developed here (but not incompatible with them) is that the children had difficulties comprehending because of limits in their accuracy and fluency of decoding. Apart from small groups within classes who were having special instruction (such as Rainbow Reading), the teachers generally felt that accuracy and fluency was not a problem. They could refer to running records and sources of evidence for this. The pattern of results in the PAT and STAR are also generally consistent with this. The Word Recognition sub-test of the STAR had the highest scores, and some later passages on the PAT were done better than earlier passages. One school had examined the same hypothesis by comparing students on the word recognition PAT with the reading comprehension PAT. The former was consistently higher.
Longitudinal cohort analyses
The following analyses track the achievement of cohorts of students from the beginning to the end of the project (i.e. from Time 1: Term 1, 2003 to Time 6: Term 4, 2005). Analyses were conducted only with the same students who sat all six tests, to avoid any confounding effects from students with differential exposure to the programme. Because of the three-year timeframe with the focus on Years 4–9, this meant that the students available to be tracked were those who began with the project in Year 4 (Cohort 1), Year 5 (Cohort 2) and Year 6 (Cohort 3), who would be in Years 6, 7 and 8 respectively at the end of the project. The analyses also excluded two students who were retained in one year level.>[3]
The achievement of other students not represented in this analysis can be found in the following section.
Overall gains in achievement across cohorts
There was a statistically significant overall acceleration in achievement from Time 1 to Time 6 of 0.97 stanine. This represents about one year’s progress, in addition to expected national progress over the three year period. Table 5 presents the mean stanine and raw scores for cohorts of students tracked across the three phases of the project.) By the end of the project, the average student scored in the “average band of achievement”. At the beginning of the project, the average student had scored in the “below average” band.
Table 5 Stanine and Raw Score Means by Cohort at Time 1 (Feb 03) and Time 6 (Nov 05)
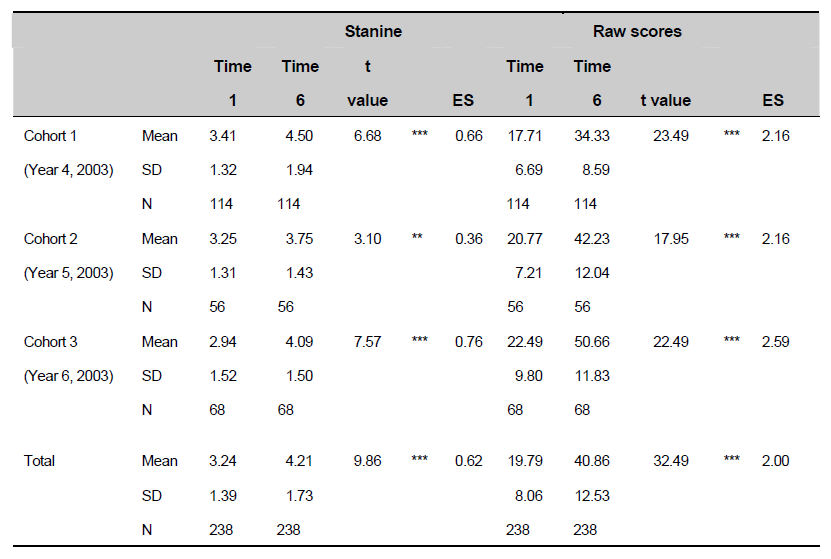
All cohorts made statistically significant accelerations in achievement across the three years. The effect sizes for the age adjusted scores and raw scores are higher than reported in international studies on schooling improvement initiatives, which report effects of between 0.1 and 0.3[4] (Annan & Robinson, 2005), although Borman reports on a small number of studies of school improvement which cumulatively, over more than seven years, achieved gains with effect sizes of around 0.5.
Figure 8 and Figure 9 present the overall changes for the total cohort in terms of the stanine distributions. Figure 8 displays the percentage of students in each stanine at the beginning (Time 1) and the end of the project (Time 6). Figure 9 shows the percentage of students in each of the achievement bands. Table 6 provides the mean percentages in each of these bands. There was a marked reduction in the percentage of students at the lower stanines (to 6 percent in the Low band and 26 percent in the Below Average band) and an increase in the percentage of students in the Average band (to 59 percent in stanine 4–6) and Above Average and Outstanding band (to 10 percent in stanine 7–9). The results therefore more closely approximate the national norms.
Figure 8 Stanine distribution at Time 1 (Term 1, 2003) and Time 6 (Term 4, 2005) against national norms
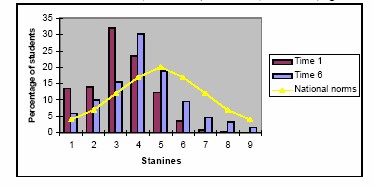
Figure 9 Percentage scoring at low, below average, average, above average and outstanding bands at Time 1 (Term 1, 2003) and Time 6 (Term 4, 2005) against national norms
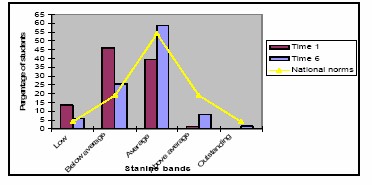
| Low (Stanine 1) |
Below Average (Stanine 2-3) |
Average (Stanine 4-6) |
Above Average (Stanine 7-8) |
Outstanding (Stanine 9) |
|
|---|---|---|---|---|---|
| Expected | 4 | 19 | 54 | 19 | 4 |
| (9.5) | (45.2) | (128.5) | (45.2) | (9.5) | |
| Time 1 | 13 | 46 | 39 | 1 | 0 |
| (32) | (109) | (94) | (3) | (0) | |
| Time 6 | 6 | 26 | 59 | 8 | 2 |
| (19) | (61) | (140) | (19) | (4) |
However, the demonstration of the educationally significant shift of the local distribution to near national distribution should not mask the finding that still more students need to score within the above average and outstanding bands to fully match national norms. The observed stanine distributions at Time 1 (T1) and Time 6 (T6) can be compared with the expected (normal) distribution. Because of small cell sizes at T1 in the banded stanines, the band cells were combined into two cells: number of students in stanines 1–3 and in stanines 4–9. The distributions at T1 were significantly different (X2 (1) =176.5, p<.000). At T6, the distributions were not significantly different at p<.001, but were at .01 (X2(1) = 9.72, p<.01) (note p.01 = 9.21). With a stringent test (p=.001), the two cell comparison shows that the distributions are similar, but the less stringent test supports the conclusion that more gains are needed to better approximate the expected distribution. The shift from T1 to T6 can be expressed in terms of the risk of not being at average or above levels. The risk at T1 was 1.9 (i.e., the risk was almost double what would be expected). This reduced to a risk of 1.1 at T6, showing that there was by then only a small risk of not being at average or above average levels.
Gains in achievement across phases
The total group made statistically significant accelerations across each phase (see Table 7). On average, these were higher in Phase 1 (mean stanine gain=0.47) and Phase 3 (mean stanine gain=0.51) than in Phase 2 (mean stanine gain=0.35). Individual cohorts had somewhat variable patterns. The raw score results in Table 8 show that all cohorts made statistically significant gains in raw score points in each phase.
Table 7 Stanine Means by Cohort for Phases 1, 2, and 3 (Time 1–6)
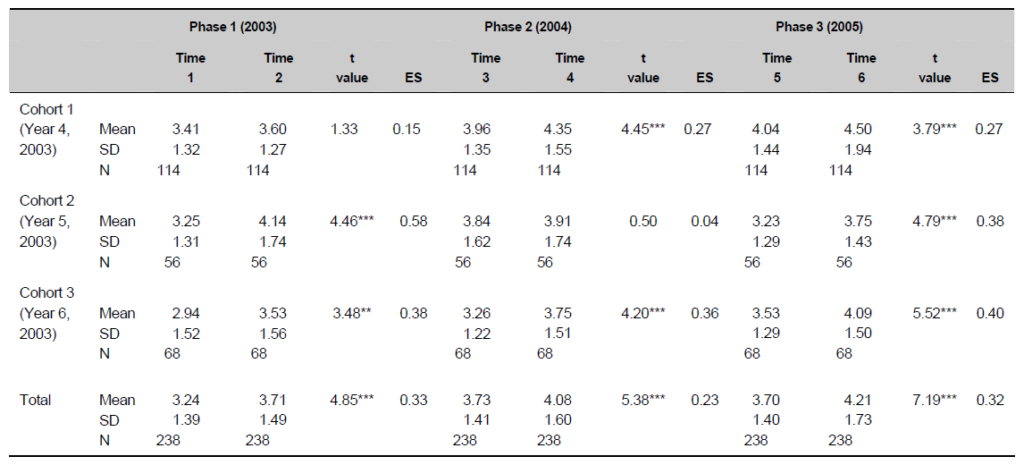
Table 8 Raw Score Means by Cohort for Phases 1, 2, and 3 (Time 1–6)
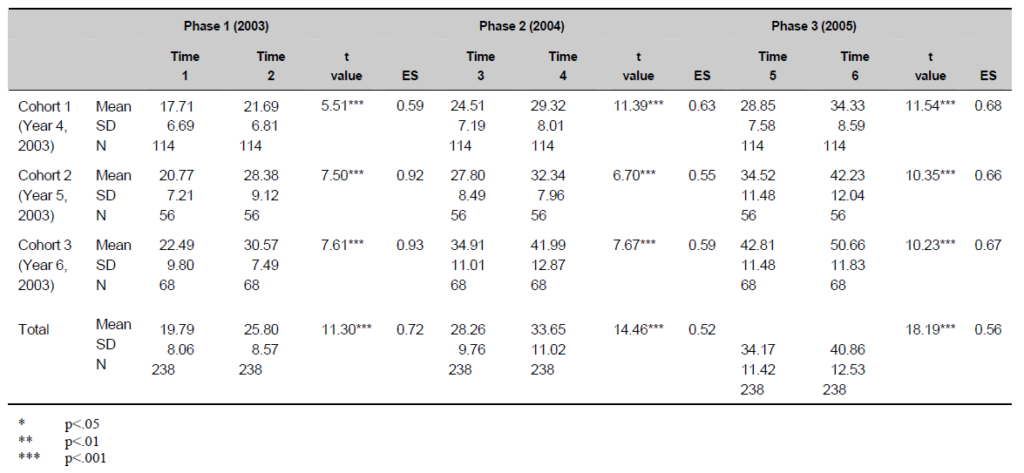
Gain scores
When compared with nationally expected progress, 89 percent of students maintained or accelerated their achievement from the beginning to end of the project. The majority of students (60 percent) gained between one and five stanines, or maintained their stanines from the beginning of the project (29 percent). Figure 10 shows the gain scores from the beginning and end of the project.
Figure 10 Gains scores from Time 1 to 6 for longitudinal cohorts of students
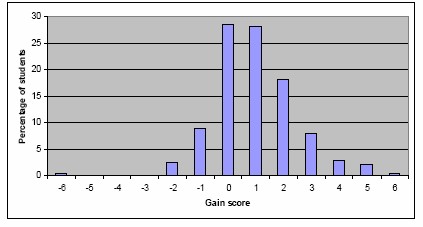
The gain scores, when broken down by phase, show that in each phase most students maintained or accelerated achievement over the three years (78 percent, 83 percent and 86 percent respectively), with about half the students in each phase accelerating achievement (see Figure 11). There was also a trend towards a decreasing percentage of stanine losses by the end of the project, with fewer students not making expected progress for the year.
Figure 11 Percentage of loss, maintenance and acceleration across the three phases
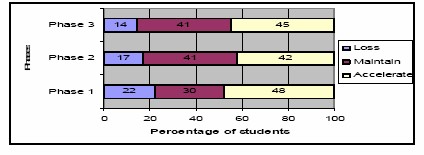
The achievement of Mäori students
Mäori students’ achievement accelerated, like the other ethnic groups participating in the project (see Figure 12), gaining on average 1.1 stanines across the three years. By the end of the project, the average Mäori student scored within the “average” band (mean =4.73), which was only 0.27 below the expected national average of stanine 5 (see Table 9). Indeed, cohort 1 (Year 4) Mäori students at Time 6 achieved above the national expected average, at stanine 5.29. By contrast, at the beginning of the project, the average Mäori student scored in the “below average” band.
The intervention was designed from the profiles of the local students and their instruction. It contained elements that were designed to be both generic for the population of students, and to be personalised using cultural and linguistic resources. It appears that the fine tuning of instruction across the three phases of the research and development programme enabled this to happen.
Other ethnic groups combined made slightly under one stanine gain (0.95) across the three years. They scored within the “below average band” at the beginning of the project, and within the “average” band by the end, although their stanine scores were slightly further than those of the Mäori students from the expected national average of stanine 5 at the end of the project.
Figure 12 Mean achievement gain (in stanines) for Mäori students, compared with other ethnic groups combined
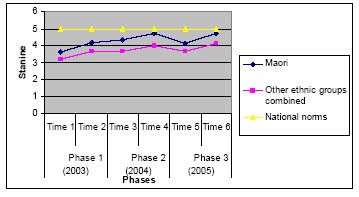
Table 9 Stanine Means by Cohort for Mäori Students and Other Ethnic Groups Combined, from Beginning to End of the Project
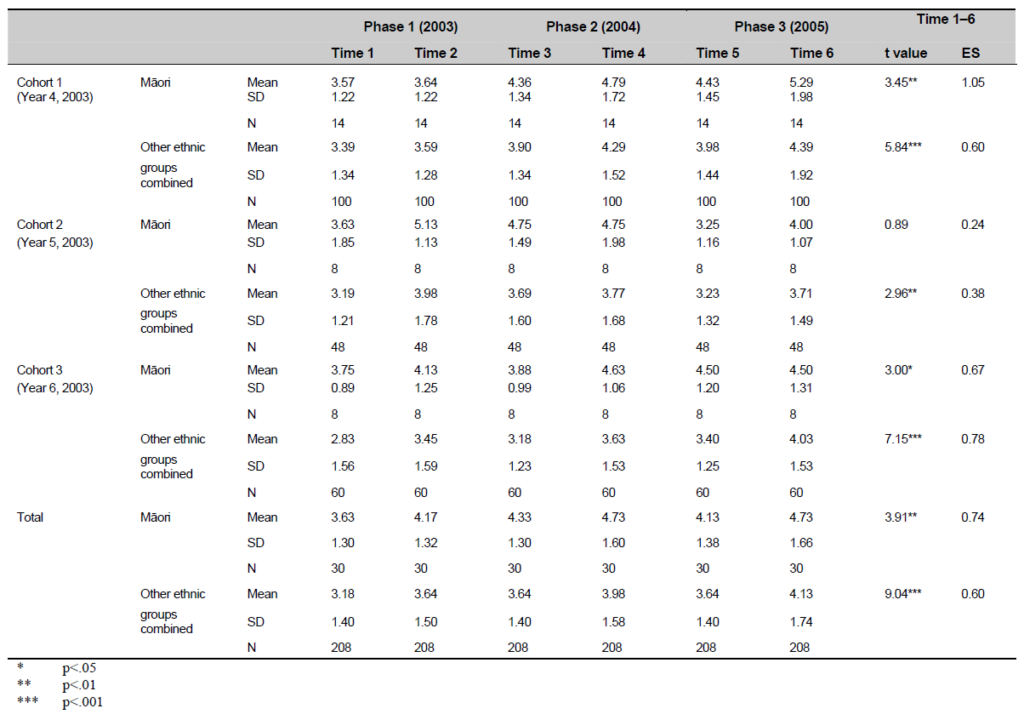
The achievement of males and females
Overall, both males and females accelerated significantly (see Table 10). By Time 6, female students on average scored in the average band of achievement, whereas at the beginning, they scored in the below average band. Male students scored slightly under the average band (mean = 3.97) by the end of the project.
Figure 13 shows that while both males and females made similar rates of progress over the three years in the intervention, female students, on average, started with higher levels of achievement than male students. Male students will need to accelerate their achievement more than female students if the gap between male and female students is to be closed.
Table 10 Stanine Means by Cohort for Gender — Phase 1, 2, and 3 (Time 1–6)
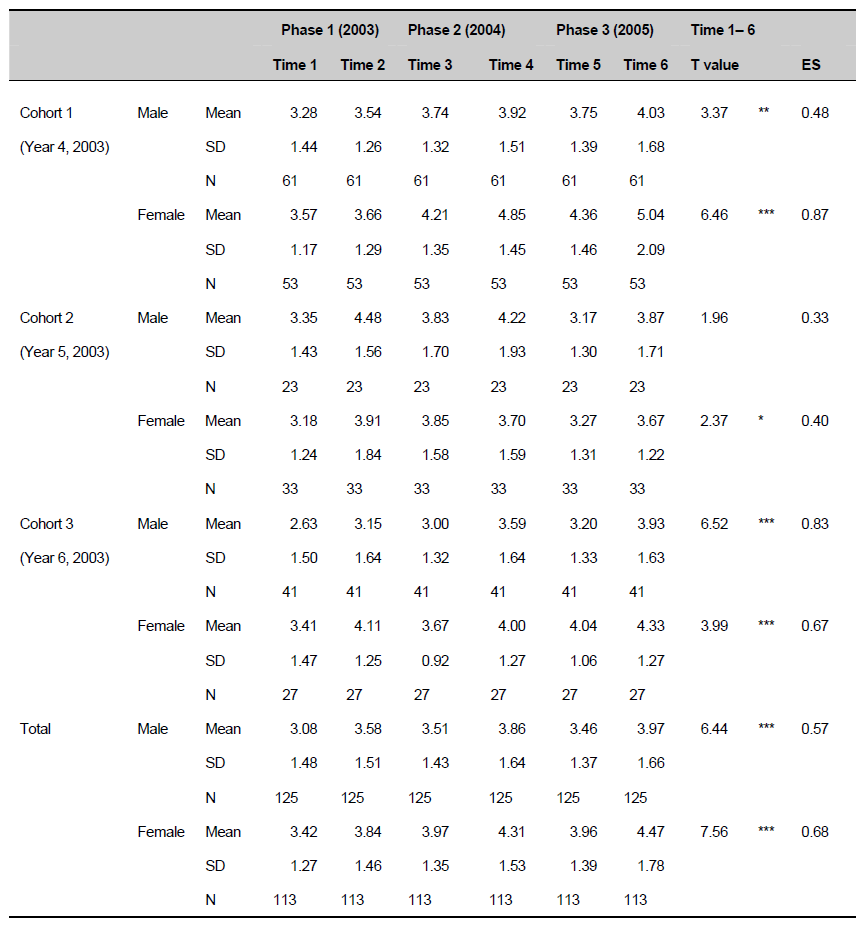
Figure 13 Stanine means by gender — Phase 1, 2, and 3 (Time 1–6)
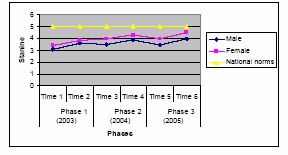
School gains across the three phases
Four schools could be analysed using the longitudinal cohorts (they contained students in Years 4–6). Each school made statistically significant accelerations in achievement from the beginning to the end of the project, with effect sizes of between 1.15 and 0.39 (see Table 11). The largest gain was over two stanines for one school, from 3.27 to 5.48. By the end of the intervention, three schools were scoring in the average band of achievement, as opposed to the below average band of achievement at the beginning of the project.
The pattern across schools was one of increasing acceleration in achievement from Time 1 to Time 6, although there was variation across schools in the amount of gain, and in the pattern of losses and gains over the three phases (see Figure 14). For example, School C made consistent gains over the time points and a significant gain between Time 5 and 6. School F, by contrast, made a larger gain in Time 1 and 2, and maintained the gains they made from Time 2, with no further accelerations. Some schools had larger losses over the summer break than others (such as School E and school B), showing a drop in achievement between Time 4 (end of 2004) and Time 5 (beginning of 2005). However, this was not consistent across phases, as both schools did not show such large losses from the end of 2003 to the beginning of 2004.
Table 11 Stanine Means by Cohort for School — Phase 1, 2, and 3 (Time 1–6)
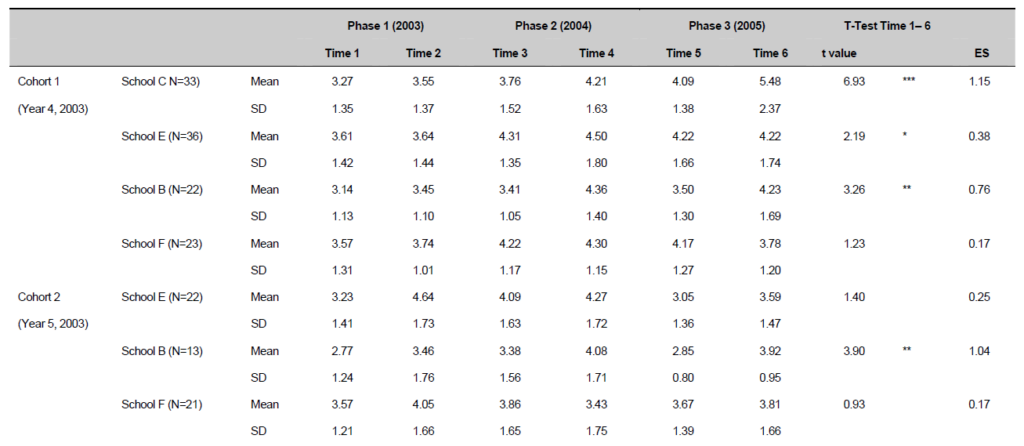
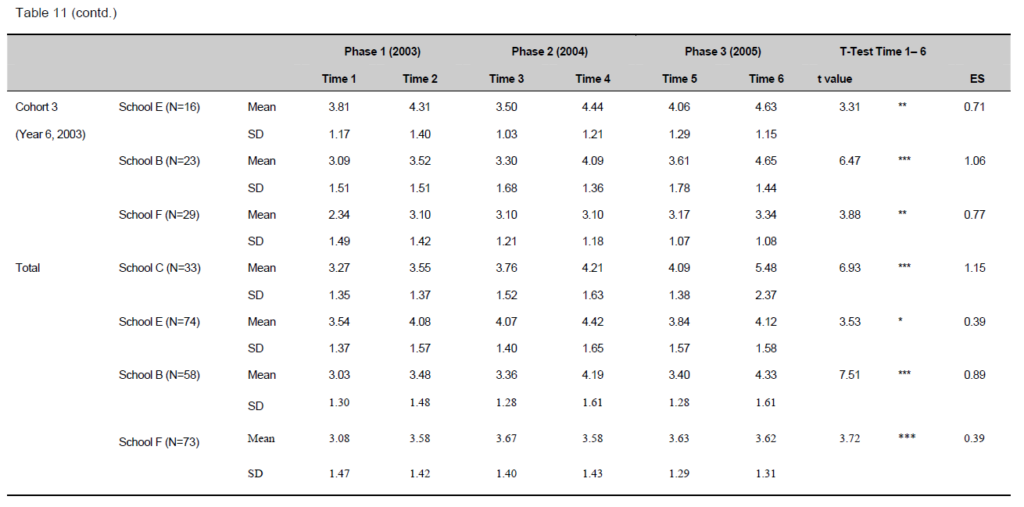
* p<.05
** p<.01
*** p<.001
Figure 14 Stanine means by school — Phases 1, 2 and 3 (Time 1–6)
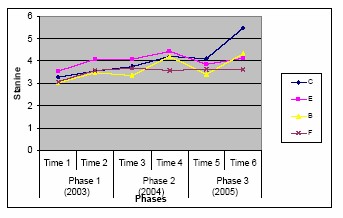
Not all cohorts within and between schools made similar amounts of acceleration through the intervention (see Table 11). School F showed the widest disparity between cohorts, with one cohort having an effect size of 0.77, and the others having effect sizes of 0.17. Cohorts in other schools were more consistent, although there were still slight differences between them.
Design-based longitudinal and cross-sectional comparisons
In design terms, the previous analyses simply used pre- and post-measures, with no comparison against control groups or equivalents. Therefore, gains are not able to be systematically attributed to the intervention. To better test that attribution, gains were analysed, first as parallel comparisons with the projected means for each year established by the cross-sectional baseline, and secondly against a comparison group of similar schools (see the discussion of the design controls, p.20).
Cross-sectional analyses indicate that after one year of the intervention, all cohorts were statistically significantly higher than the projected baseline (see Table 12). This provides the initial design based evidence that the gains can be systematically attributed to the intervention.
| Cross Sectional Baseline |
Cohorts after one year of intervention |
|||||
|---|---|---|---|---|---|---|
| (Time 1, Feb 03) | (Time 3, Feb 04) | t value | ES | |||
| Year 4–5 | Mean | 3.42 | 3.96 | 3.12 | * | 0.37 |
| SD | 1.57 | 1.35 | ||||
| N | 241 | 114 | ||||
| Year 5–6 | Mean | 3.15 | 3.84 | 3.04 | ** | 0.44 |
| SD | 1.55 | 1.62 | ||||
| N | 296 | 56 | ||||
| Year 6–7 | Mean | 2.83 | 3.26 | 2.51 | * | 0.34 |
| SD | 1.29 | 1.22 | ||||
| N | 307 | 68 | ||||
* p<.05
** p<.01
*** p<.001
Further analysis suggests that after two years of the intervention, all cohorts were not just statistically significantly higher than the projected baseline (see Table 13), but that the difference between their scores and those of students in the same year level two years previously had increased (see Tables 12 and 13). The effect sizes were now between 0.31 and 0.59, compared with 0.34 and 0.44 after one year of the intervention. This means that the intervention had a cumulative and positive effect on achievement. This is portrayed diagrammatically in Figure 15.
| Cross Sectional Baseline |
Cohorts after two years of intervention |
|||||
|---|---|---|---|---|---|---|
| (Time 1, Feb 03) | (Time 5, Feb 05) | t value | ES | |||
| Year 4–6 | Mean | 3.15 | 4.04 | 5.28 | * ** | 0.59 |
| SD | 1.55 | 1.45 | ||||
| N | 296 | 114 | ||||
| Year 5–7 | Mean | 2.83 | 3.23 | 2.12 | * | 0.31 |
| SD | 1.29 | 1.29 | ||||
| N | 307 | 56 | ||||
| Year 6–8 | Mean | 2.95 | 3.53 | 3.04 | ** | 0.42 |
| SD | 1.45 | 1.29 | ||||
| N | 299 | 68 | ||||
* p<.05
** p<.01
*** p<.001
Figure 15 Time 1-6 cohorts against 2003 baseline
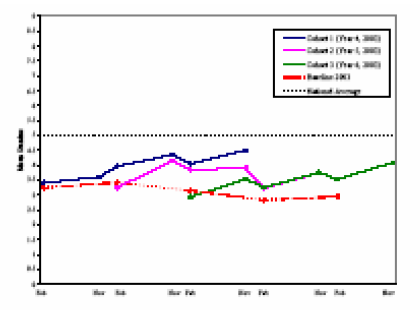
We added two features to increase the robustness of the design. The first was to test the issue of subject selection bias. We showed that the students in the longitudinal cohorts did not generally differ from all students in terms of initial achievement levels. The second was to compare the baseline projections with a cross-sectional baseline from a similar cluster of schools after a year had elapsed, thereby controlling for general history and maturation and other associated factors. To follow this latter comparison up, and show that the baselines did not differ significantly, we have compared the outcomes of the intervention in the first cluster with the baseline of the second cluster (Tables 14 and 15).
It should be remembered that the second cluster had similar characteristics, but had not gone through the programme. In both clusters, there were seven decile 1 schools (including one intermediate) involved in a New Zealand Ministry of Education school improvement initiative; similar numbers of students in the baseline sample; similar proportions of males and females; and the same four major ethnic groups. The prior intervention histories of these initiatives were also similar. In both clusters, the same Ministry of Education school improvement initiative, Strengthening Education In Mangere and Otara, was implemented prior to the research (Annan, 1999). The intervention began with one year delay across the two clusters, and focused on the collection and analysis of data. Nonetheless, there were some differences between clusters, particularly in the establishment of professional learning communities, and in prior experience with analysing and interpreting the reasons for achievement patterns.
After one year of the intervention, all year level cohorts scored statistically significantly higher than the comparison cluster that had not experienced this intervention (see Table 14).
| Cross sectional comparison cluster (Feb 04) |
Mangere cohorts after one year of intervention (Time 3, Feb 04) |
t value |
ES |
|||
|---|---|---|---|---|---|---|
| Year 5 | Mean | 3.39 | 3.96 | 3.42 | ** | 0.40 |
| SD | 1.53 | 1.35 | ||||
| N | 248 | 114 | ||||
| Year 6 | Mean | 3.32 | 3.84 | 2.28 | * | 0.33 |
| SD | 1.51 | 1.62 | ||||
| N | 237 | 56 | ||||
| Year 7 | Mean | 2.71 | 3.26 | 3.43 | ** | 0.45 |
| SD | 1.22 | 1.22 | ||||
| N | 360 | 68 | ||||
* p<.05
** p<.01
*** p<.001
After two years of the intervention, all year level cohorts scored significantly higher than the comparison cluster that had not experienced this intervention (see Table 14), and the difference between their scores and those of students in the same year level a year previously had increased (see Tables 14 and 15). The effect sizes were now between 0.41 and 0.61, compared with 0.33 and 0.45 after one year of the intervention. This provides further evidence that the intervention was systematically associated with improving student achievement.
| Cross sectional comparison cluster (Feb 04) |
Mangere cohorts after two years of intervention (Time 5, Feb 05) |
t value |
ES |
|||
|---|---|---|---|---|---|---|
| Year 6 | Mean | 3.32 | 4.04 | 4.21 | *** | 0.49 |
| SD | 1.51 | 1.45 | ||||
| N | 237 | 114 | ||||
| Year 7 | Mean | 2.71 | 3.23 | 2.95 | ** | 0.41 |
| SD | 1.22 | 1.29 | ||||
| N | 360 | 56 | ||||
| Year 8 | Mean | 2.75 | 3.53 | 4.60 | *** | 0.61 |
| SD | 1.26 | 1.29 | ||||
| N | 305 | 68 | ||||
* p<.05
** p<.01
*** p<.001
Overall changes for total school populations year by year
A third way to analyse the achievement outcomes is to check the achievement of students across years, irrespective of presence or absence in any other year. This analysis answers the question of whether changes can be detected in how the school teaches all children, irrespective of membership in a continuously present cohort.
The following analyses, therefore, examine improvements in achievement from the beginning (Term 1) to end (Term 4) of an academic year in each of the three phases. Analyses for each phase were calculated only from the results for the students who sat both beginning and end of year tests in the academic year, to avoid any confounding effects from students with differential exposure to the programme. It should be noted that each phase built on the previous phase, and included processes that were part of that phase. Common to each phase was the analysis, feedback and discussion of evidence. Note that Phase 1 contains fewer students, because one school could not participate in the first round of data collection.
Overall gains in achievement
Table 16 includes all children present at both the beginning and end of each year of testing. The Term 1 and Term 4 comparisons show two things. The first is that each year, statistically significant gains were made from the beginning to the end of the year. This means that with the combination of continuing students, as well as new students, at each level, the effectiveness of the programme in accelerating student achievement in addition to expected national progress was sustained. Students made between 13 and 18 months’ worth of progress, approximately, for a year at school.[5] Phase 1 was associated with the greatest accelerations in achievement, and Phase 2 with the smallest accelerations in achievement. (The reasons for this are discussed in the section on classroom gains in achievement.) The improvements in mean stanine are shown graphically in Figure 16. The second finding is that each year did not start at the initial level established in 2003, or finish at the levels in the first year, so that achievement levels tended to rise.
| Term 1 | Term 4 | Gain | T value | Effect size | |
|---|---|---|---|---|---|
| Phase 1 (n=1216)
Stanine |
3.13 (1.45) |
3.66 (1.64) |
0.53 |
14.09*** |
0.34 |
| Raw Score | 26.82 (12.53) | 34.20 (14.42) | 7.39 | 31.07*** | 0.55 |
| Phase 2 (n=1683)
Stanine |
3.51 (1.58) |
3.61 (1.70) |
0.10 |
3.62*** |
0.06 |
| Raw Score | 31.84 (14.77) | 35.63 (13.85) | 3.80 | 21.85*** | 0.26 |
| Phase 3 (n=1619)
Stanine |
3.41 (1.58) |
3.81 (1.73) |
0.39 |
14.67*** |
0.24 |
| Raw Score | 30.69 (14.21) | 36.71 (14.32) | 6.02 | 34.13*** | 0.42 |
* p<.05
** p<.01
*** p<.001
Figure 16 Mean stanine for beginning (Term 1) to end (Term 4) of year in each Phase
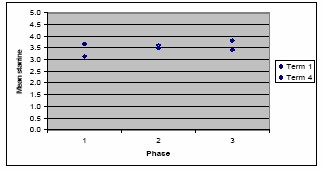
Figure 17 shows the percentage of students in the achievement bands of low (stanine 1), below average (stanines 2–3), average (stanines 4–6), above average (stanines 7–8) and outstanding (stanine 9). In each phase, there was a trend towards the nationally expected percentage of students in each band by Term 4.
Figure 17 Percentage of students in stanine bands in each phase (Term 1 to Term 4) compared to national expectations
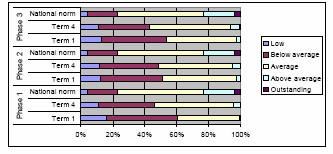
While there were statistically significant improvements in mean scores (stanine and raw scores), increasing trends towards the nationally expected distribution, and comparable effect sizes to successful international interventions, at the end of the project there were still fewer students in the average and above average bands than nationally expected. Schools in the intervention therefore still need to focus on improving student achievement further, through sustaining their improved teaching and inquiry practices, and developing new interventions to cater for the students who are now at and above average in their schools.
Year level gains in achievement
All year levels made statistically significant accelerations in achievement, in addition to expected national progress in Phases 1 and 3 (see Table 17). Phase 2 was associated with greater variability in achievement between year levels. In Phase 2, one year level (Year 6) did not make statistically significant accelerations in addition to expected national progress, and one year level (Year 8) made a significant loss in comparison to national expectations. However, in that phase, all year levels made statistically significant gain in achievement (as measured by raw scores) from the beginning to the end of the year. In other words, while on average students in those year levels gained in raw score points, this was insufficient (when adjusted to nationally expected progress for a year) to maintain and/or increase their stanine scores. The trends across year levels in each phase are shown graphically in Figure 18. Note that Year 5 is consistently within the average band by the end of the year, and Year 6 is within the average band by the end of the year in Phases 2 and 3.
Figure 18 Mean stanine (Term 1 and 4) in each phase by year level
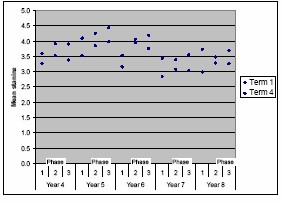
Table 17 Mean Stanines and Raw Scores (and Standard Deviations) Across Year Levels for Phases 1, 2 and 3
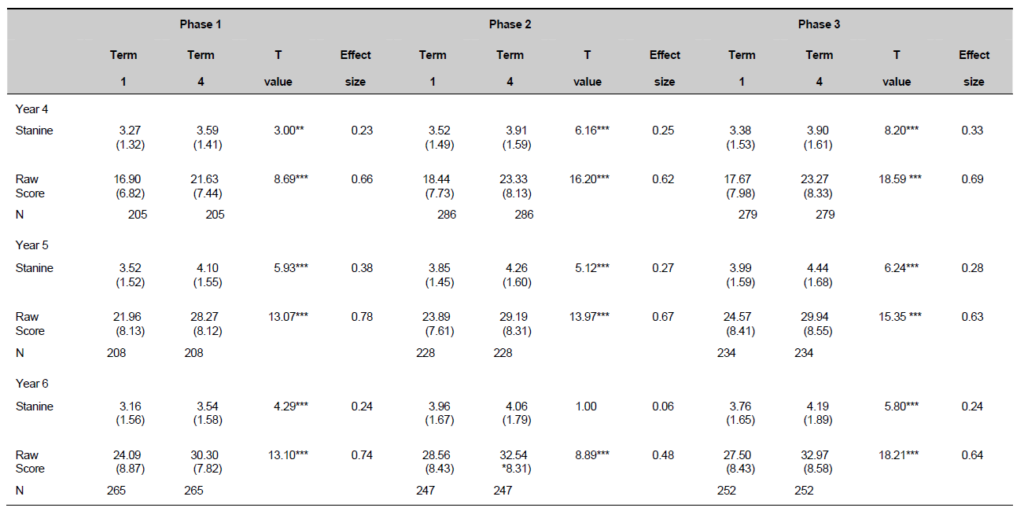
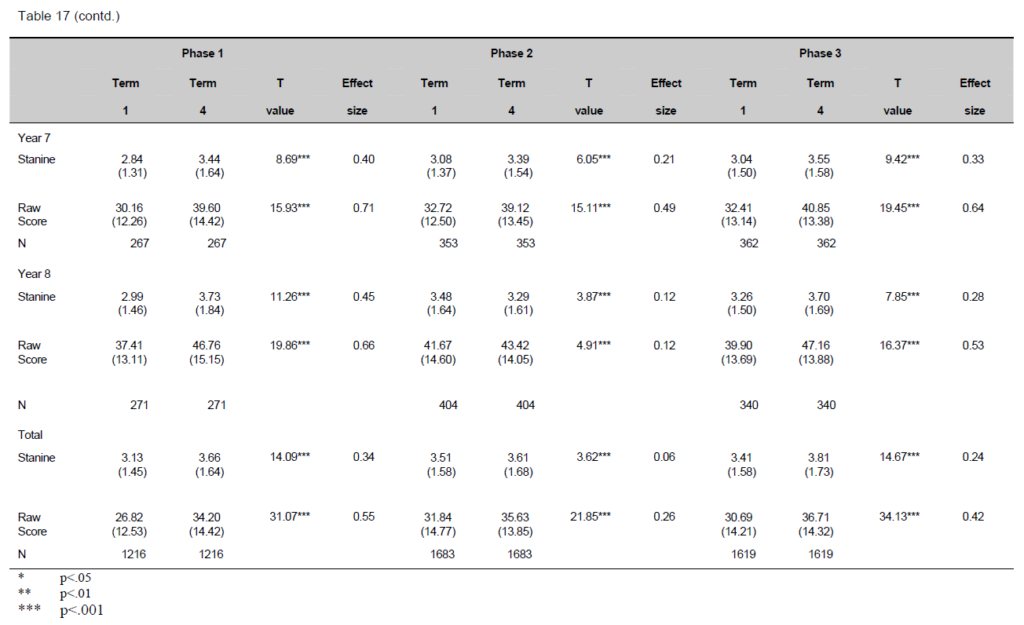
School gains across the three phases
All schools made statistically significant accelerations in achievement in Phase 1, with all but one making significant accelerations in achievement in Phase 3 (see Table 18). The one school that made a significant loss, compared with national expectations, increased their mean raw score significantly, but this was insufficient (when adjusted to nationally expected progress for a year) to maintain their stanine scores. In Phase 2, there was greater variability across schools. Three out of seven schools made statistically significant accelerations in achievement, compared with national expectations, and one school made a significant loss. However, all schools made statistically significant gains in Phase 2, as measured by raw scores, but this was insufficient (when adjusted to nationally expected progress for a year) to increase their stanine scores.
A range of gains was made between schools and within schools across the three phases. This suggests that schools may have differentially benefited from the combination of processes associated with the three phases. There did not, however, appear to be a Matthew effect, where schools who were already succeeding gained more from the professional development (see Figure 19). This suggests that the impact of the professional development is mitigated somewhat by school characteristics. Some of the characteristics of schools that may have impacted on the achievement results are discussed in greater detail in the next section, on gains in achievement across classrooms.
Table 18 Mean Stanines and Raw Scores (and Standard Deviations) for Terms 1 and 4 for Each Phase by School
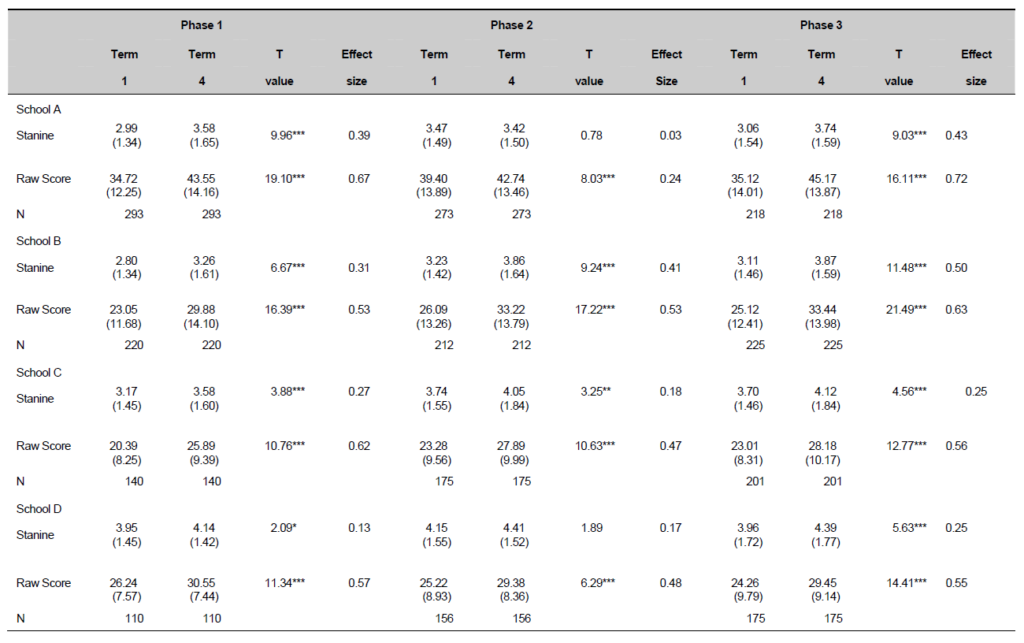
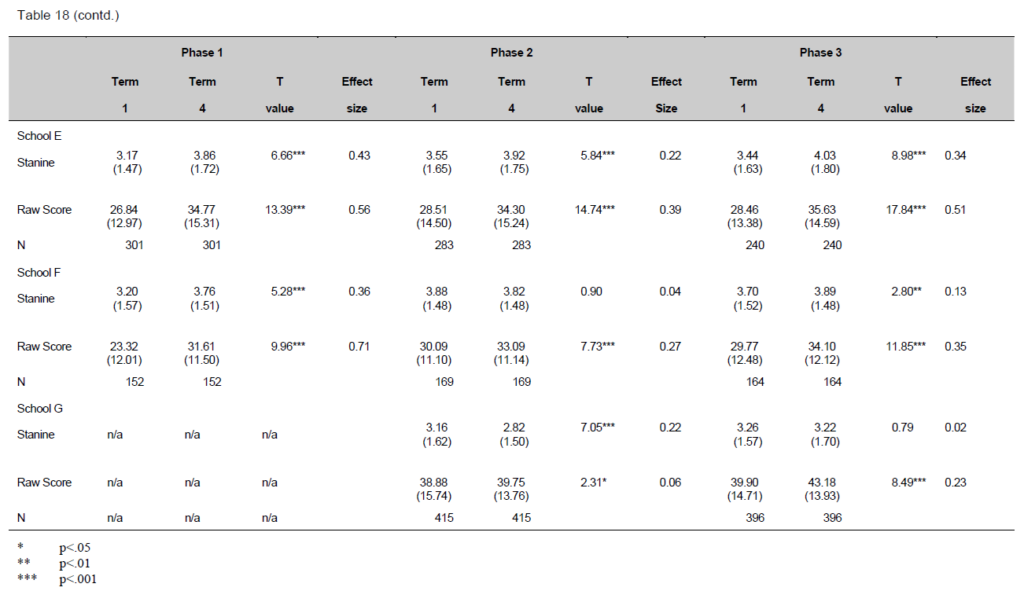
Figure 19 Mean stanine in each phase by school
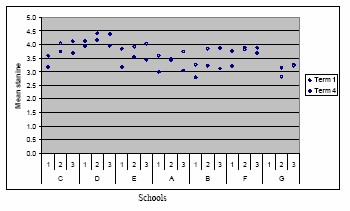
Classroom gains across the three phases
The gains in achievement in each classroom provide some explanation for the differences in the three phases. The following figures (Figures 20, 21 and 22) show the gain scores in each classroom from Term 1 to 4 in Phases 1, 2 and 3 respectively. Phase 1 was associated with the most consistent gains across classrooms, with 88 percent (52 out of 59) classrooms making accelerations in achievement. By contrast, Phase 2 was associated with the least consistent gains between classrooms, with 58 percent (46 out of 79) classrooms making accelerations in achievement. Even so, over half the classrooms made accelerations in achievement. In Phase 3, the gains came between those of the other two phases, in that nearly three-quarters, 74 percent (58 out of 78) classrooms made accelerations in achievement.
Figure 20 Mean stanine gain score for classes in Phase 1
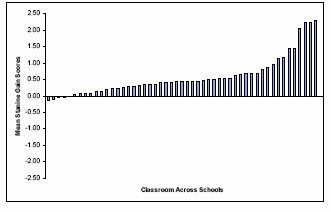
Figure 21 Mean stanine gain score for classes in Phase 2
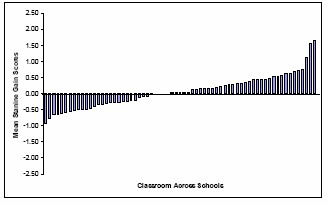
Figure 22 Mean stanine gain score for classes in Phase 3
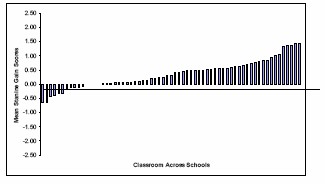
Further analyses indicated that two schools were the primary reasons for the higher percentage of stanine losses in Phases 2 and 3. The school that was missing in Phase 1, School G, accounted for most of the stanine losses in Phases 2 and 3, in that 45 percent of the classes in Phase 2 and 60 percent of classes in Phase 3 that made stanine losses were from that one school. Another school, School A, contributed to 24 percent of the stanine losses in Phase 2, although by Phase 3, only one of its classrooms made a stanine loss on average.
The reason for School A contributing 24 percent of the stanine losses in Phase 2 is most likely to be the nature of the participation of the school in the professional development. All teachers participated in Phase 1, and classrooms made stanine gains on average (i.e. every classroom average accelerated their achievement). But School A withdrew most of its teachers in Phase 2, in that only one teacher consistently attended the professional development, and no school leader did. Table 19 shows attendance by staff and the school leader for nine sessions in Phase 2. A low participation rate was associated with 7 out of 13 classrooms in School A which made stanine losses, i.e. they did not maintain the expected progress, compared with national norms. However, when more teachers in that school participated in Phase 3, only one of its classrooms made stanine losses, and the rest made accelerations in stanines.
One indication of the degree of participation in Phase 3 was the number of inquiry project presentations at the teacher conference (see Table 20). School A had a history of incomplete participation, with analyses of participation in another intervention prior to this one showing that they had only completed one of the two task requirements of the programme (Lai et al., 2003). Any future interventions with this school may need to stress the importance of fully participating in the programme.
| School | Teachers ¹ | Leader ² |
|---|---|---|
| B | 3 | 2 |
| D | 3 | 3 |
| E | 3 | 3 |
| C | 3 | 1 |
| G | 3 | 3 |
| F | 3 | 3 |
| A | 1 | 0 |
¹ 1= fewer than 5 sessions; 2= 5-7 sessions; 3= 8-10 sessions
² 0=did not attend; 1=fewer than 5 sessions; 2=5-7 sessions; 3= 8-10 sessions
| School | Presentation¹ |
|---|---|
| School B | 3 |
| School D | 3 |
| School E | 3 |
| School C | 3 |
| School G | 3 |
| School F | 0 |
| School A | 1 |
¹ 0=no staff presentation; 1=one presentation (representing less than 50% classes); 2=more than 1 but not all classes represented; 3=all staff at all levels contributing.
Nonetheless, the school that had a high percentage of stanine losses in Phases 2 and 3 (School G) had high rates of participation in both phases (see Tables 19 and 20). Therefore, participation was unlikely to be the reason for the high percentage of losses in this school. Three hypotheses can be advanced to explain the results. The first relates to ceiling or floor effects. The other two relate to the school’s capacity to analyse and use achievement data (one key capacity needed to raise achievement in this intervention) and the teachers’ implementation of the professional development in their classrooms.
The first hypothesis was that this school had significantly lower or higher achievement than other schools, suggesting, respectively, either greater difficulty in accelerating achievement, due to large percentages of students being below expectations, or being closer to a ceiling. However, an analysis of the baseline information at Time 1 shows that the school that scored the lowest at this baseline (2.80) made significant accelerations in achievement in Phases 2 and 3. It is therefore unlikely that low baseline scores alone could be the reason for the patterns in achievement.
The second hypothesis is unlikely, because a previous evaluation of the capacity of school leaders in that school to analyse, interpret and use achievement data showed that the leaders had a good understanding of how to do so (Lai et al., 2003). In fact, that school showed higher ratings in their capacity to analyse, interpret and use achievement data than some other schools in the intervention. As the leaders had not changed since the beginning of the intervention, the leaders had the capacity to analyse, interpret and use data to inform classroom practices. Moreover, the leaders had also demonstrated that they had taught and checked the understanding of teachers as to how to analyse, interpret and use data in that school (Lai et al., 2004).
The final hypothesis relates to classroom practices. There was little difference in the ratings of School G teachers’ classroom practices, compared with other schools. In the second year, five Literacy leaders rated their teachers for aspects of their classroom programme (see Table 21). The ratings were from 0–3 on each dimension (see Appendix A). One leader did not rate teachers, because at the end of the year that lead teacher left the school; another did not close because of limited involvement in the professional development by that school. Each of the five Literacy leaders who rated their staff overall judged that they well had established classroom routines with high engagement by students (range 2.3 – 2.7); students were rated as immersed in a rich literacy environment (range 2.0 – 2.5), where teachers generally carried out the focus of the professional development (range 2.0 – 2.5).
|
Teachers |
School | ||||||||||
|---|---|---|---|---|---|---|---|---|---|---|---|
| D (6) |
C (5) |
G (11) |
B (10) |
E (12) |
|||||||
| Routines and high engagement | 2.7 | 2.2 | 2.5 | 2.5 | 2.3 | ||||||
| Focus on PD | 2.5 | 2.2 | 2.2 | 2.3 | 2.0 | ||||||
| Richness of literacy Environment | 2.5 | 2.0 | 2.2 | 2.0 | 2.1 | ||||||
| Frequency of Instruction | 2.8 | 3.0 | 2.0 | 2.8 | 3.0 | ||||||
| Assessment | 2.5 | 2.0 | 1.9 | 2.0 | 1.7 | ||||||
| Contribution to PLC | 2.3 | 2.0 | 1.9 | 2.0 | 1.7 | ||||||
Note: Two school literacy leaders did not rate staff.
¹ Ratings in a 0-3 scale (see Appendix A).
However, as these ratings were completed by one school leader, without any form of reliability check, we cannot discount the possibility that differences between the school leaders’ in how they rated their classroom practices may have been a factor influencing different levels of gain. Detailed descriptions for the ratings and the rating system were discussed with the literacy leaders in a group session, so this possibility is less likely.
Within these overall ratings, there were individual teachers who were rated quite low. The Literacy leaders all generally rated their teachers as less than fully contributing to the professional learning community of their school (range 1.7 – 2.3), but the average rating of 2.0 meant they judged that staff generally talked and shared ideas on a range of settings, and had discussions on what they did in their classrooms. One school Literacy leader (School D) rated their teachers consistently higher than the others. The only area in which School G appeared to be consistently different from the other schools was the frequency of dedicated reading instruction sessions per week. In school G, such sessions occurred only three times a week. In each of the other schools, sessions occurred in general four or more times a week (rating 3.0). As this is a description of the curriculum delivery, this aspect is less likely to contain from any systematic bias on the ratings. It is one possible reason for the lower achievement in School G in the second year.
An additional analysis: Overall gains for all students in all schools
The final analyses present information on all students, irrespective of their continuing presence either within a year, or over a year (see Table 22 and Figure 23). This tells us about the performance of all students at any given time point, including the achievement of students at Time 7 (beginning of 2006). It shows that achievement had an upward trend, despite the inclusion of students with differential exposure to the programme. However, the achievement levels at Time 6 are lower than they were for those students who had been through the whole programme (mean = 4.21) (see Table 7). This suggests that students who had stayed through the whole programme benefited more than those who had differential exposure through the programme.
| Time 1 | Time 2 | Time 3 | Time 4 | Time 5 | Time 6 | Time 7 | |
|---|---|---|---|---|---|---|---|
| Mean | 3.10 | 3.54 | 3.49 | 3.55 | 3.36 | 3.75 | 3.61 |
| N | 1383 | 2001 | 2029 | 2024 | 1966 | 1961 | 1757 |
Figure 23 Mean achievement scores of all students at seven time points
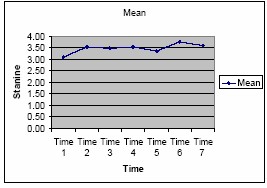
Instructional observations (all teachers), first and second years
The observations taken in classrooms in the present study used qualitative and quantitative data to plot the relationships between patterns of classroom teaching, and the achievement patterns over the first two years.
Overall achievement gains and the general instructional focus over two years
As noted above, the intervention resulted in statistically significant improvements across the first two years. These gains are summarised in Table 23 for the longitudinal cohort who were at school for two years.
There was a significant increase in achievement between the beginning assessments (February 2003) and at the end (November 2004) in every year cohort, with an overall gain for the total cohort of 586 students of 0.8 of a stanine. The breakdown for the component tests is shown in Table 23. The STAR test does not provide normalised equivalents for sub-tests, so the raw score means are presented. Significant gains occurred across two years in all tests, with very large effect sizes (using the raw scores), but a particularly large gain occurred in paragraph comprehension (mean = 5.50). It should be noted that this test had 20 items, unlike the other tests which had 10, and the degree of gain may reflect the higher ceiling.
| Beginning (Feb 03) |
End (Nov 04) |
Gain | t value |
ES |
|
|---|---|---|---|---|---|
| Total (stanines) | 3.14 | 3.94 | 0.80 | 14.73** | 0.52 |
| (1.41) | (1.63) | (1.31) | |||
| Tests (raw scores) | |||||
| decoding | 7.18 | 9.08 | 1.90 | 20.21** | 0.88 |
| (2.45) | (1.85) | (2.27) | |||
| sentence | 4.54 | 6.35 | 1.81 | 19.55** | 0.87 |
| (1.29) | (2.23) | (2.24) | |||
| Paragraph | 5.23 | 9.73 | 4.50 | 29.40** | 1.10 |
| (3.92) | (4.25) | (3.71) | |||
| Vocabulary | 3.89 | 5.89 | 1.99 | 19.56** | 0.91 |
| (1.99) | (2.40) | (2.47) | |||
Video records of 15 classrooms were taken at the beginning of the second school year (February 2004). All 15 of these teachers had been involved in the first year for the baseline profile, but only three had been observed in the first year. Unfortunately, direct comparisons with the running record and diary data in the previous year are not possible, given the differences in teachers and in methodology, with the approach in Year 2 being more systematic in recording and analysing classroom data. However, general comparisons are still possible, given use of both qualitative and (a limited number of) quantitative analyses at both times.
The 15 teachers represented 25 percent of the total group of teachers, but they were not randomly selected; they volunteered to be observed. Nevertheless, they can be used here as indicative of teaching after the first year in the programme, for two reasons. First, they came from each of the schools and were in classrooms covering all the levels within schools. Secondly, the average gain made in their classrooms in the first year (mean = 0.47 stanine) was similar to the overall gain for the other 49 teachers (mean = 0.55 stanine).
The means for the exchange types (see p.33) observed in their classroom at the beginning of the second year are shown in Table 24. The overall number of exchanges in 38.6 minutes was 24.9, with a high proportion of these (77.5 percent) being focused on a text, either during the reading of that text, or in preparations or follow up which referred directly to the text.
Table 24 Mean Exchanges (and Standard Deviations) at the Beginning of the Second Year (2004) for Observed Teachers (N=15 Teachers)
| Types of Exchanges | Beginning 2004 |
|---|---|
| Total exchanges | 24.90 (13.20) |
| Text related | 19.30 (10.00) |
| Vocabulary question T | 6.53 (4.50) |
| Vocabulary comment T | 3.90 (3.00) |
| Extended talk T | 6.93 (6.71) |
| Extended talk C | 5.80 (5.80) |
| Text check T | 5.00 (6.60) |
| Text check C | 4.00 (4.03) |
| Incorporation | 4.30 (3.71) |
| Awareness strategy | 7.20 (8.60) |
| Awareness other | 9.60 (8.53) |
| Feedback- High | 15.53 (9.52) |
There were between four and seven exchanges in which there was elaboration of words or extended talk, either by the teacher or by students. Notably, the lowest frequency of any exchange type was elaboration of vocabulary through teacher comments. The less systematic estimate made from the records in the first year suggested 6–7 interactions per teacher, but this was not based on the exchange unit of analysis (which could contain several topic related interactions). A tentative conclusion is that some increase in vocabulary related talk took place during the first year. Like the first year classroom observations, the transcripts reveal the presence of many exchanges which were focused on the development of technical language, especially in relationship to strategies.
The overall rates of exchanges which involved checking by either the teacher or student were higher than the observations indicated in the first year. The 15 teachers were observed to employ a mean of five exchanges focused on checking for evidence in texts, over the average 38.6 minute lesson time. The mean rate for children was four exchanges. This compares with a total of nine interactions in the records for the first year, over 16 hours, involving 16 teachers. The rate at the beginning of the second year comes from observations of both whole class and small group interactions. It indicates that around 20 percent of all exchanges (a mean of 24.9 exchanges per lesson) now contained some reference to checking evidence, by either teacher or child, and occurred about once every 7–8 minutes. The rate indicated in 2003 was close to once per 120 minutes. A feature of the exchanges was the large individual differences between teachers. They ranged from 11 exchanges in one classroom to 39 exchanges in another classroom.
Exchanges which incorporated cultural and linguistic resources into activities occurred at a relatively low rate, four exchanges on average in 38.6 minutes. Again, it is not possible to compare this directly with the 2003 observations; however, the diary and running records indicated these exchanges also occurred at a similarly low rate in 2003.
A noticeable feature of the teaching continued to be the teaching of strategies explicitly drawing students’ attention to the nature and purpose of the strategies. Exchanges which involved developing awareness of strategy use occurred at an average rate of seven exchanges during the reading sessions. Exchanges which built awareness of other aspects of tasks and expertise occurred slightly more frequently (9.6 exchanges). Again, direct comparisons are not possible, but this suggests an increase over the first year.
The video recording of classroom reading sessions was repeated at the end of the second year (November 2004). Nine of the teachers who were observed in the earlier group of 15 teachers were available for observation a second time. The comparisons for their classrooms are shown in Table 25. The average achievement gain in these nine teachers’ classrooms in the second year was an additional 0.40 stanine, which was similar to the gain in their classrooms in the first year (mean = 0.53 stanine), but larger than the average gain made in classrooms of all the teachers in the second year (mean = 0.17 stanine). As a group, they therefore were representative of more effective teachers across the schools and levels. It should be noted that these teachers typically were not teaching the same students in the second year as they had done in the first year.
The changes in teacher instruction in these nine classrooms are shown in Table 25. Repeated t tests (correlated means) showed that significant increases occurred in a number of exchange types. These were exchanges relating to vocabulary (teacher questions and comments) and extended talk between teachers and students. Teaching students to be aware of strategy use also increased significantly. Similarly, there was a significant increase in instruction relating to awareness of instructional tasks and formats, such as explicitly identifying learning goals. However, instruction relating to checking evidence in continuous texts, either by the teacher or by the students, did not increase further. Also, the incorporation of students’ cultural and linguistic backgrounds did not change from the beginning of the year to the end, and neither did the (already frequent) occurrence of highly informative feedback.
| Beginning 2004 | End 2004 | |
|---|---|---|
| Text related | 25.11 (8.18) | 26.67 (12.23) |
| Vocabulary questions | 8.44 (4.04) | 13.11 (9.57)* |
| Vocabulary comment T | 5.44 (2.79) | 9.33 (8.09)* |
| Extended talk T | 9.56 (7.49) | 14.22 (6.06)* |
| Extended talk C | 8.11 (6.41) | 12.67 (4.74)* |
| Text check T | 7.22 (6.32) | 8.78 (6.57) |
| Text check C | 5.33 (4.74) | 7.78 (6.18) |
| Incorporation | 6.00 (3.78) | 4.67 (4.61) |
| Awareness strategy | 9.56 (9.28) | 17.22 (9.29)** |
| Awareness other | 13.33 (8.97) | 23.11 (8.97)* |
| Feedback high | 20.67 (8.43) | 20.33 (9.95) |
* p<.05
** p<.001
Overall, there was evidence that the focus of the intervention had increased further in some areas; these were in the exchanges with a specific focus on vocabulary, sentence level comprehension, and students’ awareness of tasks and strategies. But the data also showed that the notable increases in some areas had been maintained (exchanges focused on checking, and those providing highly informative feedback). Exchanges focused on incorporation had not increased beyond levels present at the beginning of the first year. For these nine teachers, the number of text related exchanges did not change. Because of the multiple coding, this indicates that each exchange tended to have more of the four elements of the instructional focus.
This pattern of change is consistent with the patterns of gains over two years in each of the component tests shown in Table 23. Of interest, however, is the gain on the decoding test. This also increased by about the same degree, as shown by the effect size. Yet this had deliberately not been made a direct target of the intervention. Gains in decoding, as a result of a well targeted comprehension programme, have been noted in the literature before. They are likely to be due to the density effect of increased exposure to texts, and the effects of more reading practice across more texts (Lefevre, Moore & Wilkinson, 2003). The pattern of gains for students in the classrooms of the nine teachers was the same as the general pattern over two years. There were large increases over the second year in each component test (with effect sizes ranging from 0.20 to 0.73).
Case studies: High gain and expected gain teachers
The achievement gains across the two years were used to identify two teachers who provided contrasting cases in which gains were either consistently larger than expected gains (relative to chronological age change), or were at expected levels (relative to chronological age change), across the two years. The mean gains for their students on the component tests are shown in Table 26. Because these were Year 7/8 teachers, two extra component tests were added to the STAR battery. The gains for Teacher 1 were consistently high across tests, including sentence and paragraph tests. The transcript data from two points in the second year are used to examine the attributes of their teaching further.
| Component Tests | ||||||
|---|---|---|---|---|---|---|
| Decoding | Sentence | Paragraph | Vocabulary | Language | Genre | |
| Teacher 1 | 3.21 | 3.72 | 1.78 | 1.61 | 2.32 | 3.95 |
| Teacher 2 | 1.26 | 0.78 | 0.09 | 0.13 | 1.04 | 0 |
Case Study 1: High gain classroom
Teacher 1 taught in a composite Year 7/8 classroom (students aged 12–13 years) with 23 students. Children in this classroom made the highest average gain in the second year (1.56 stanines) and made about average gains for the total group of 59 teachers in the first year (0.52 of a stanine). The teaching was similar to the general approach, with use of small ability groups for guided reading and for shared reading, but with additional reading to the whole class. This teacher’s style was marked by careful preparation, with well managed and clearly structured lessons associated with high engagement.
The following sequence during shared reading with the whole class at the beginning of the second year illustrates several of the attributes of the instructional practices that were promoted, beginning in the first year. This includes contingent elaboration of vocabulary embedded in exchanges and in “mini lessons” in rich texts. Overall, there is evidence of a set to identify and understand unfamiliar words, with a focus on repeated practice over time, and across exposure in reading, writing and oral formats. For example, following a guided reading session with a low ability group, Teacher 1 summarised and directed the group as follows: “You learnt two new words today, “stared” and “wink”. Can you write (these in your book)?” There was direct and explicit reference to strategies and technical terms, in ways that focused on transfer; in the following instance, this concerns understanding the term ‘complication’ in particular genres of writing and reading.
The class had watched the film “Finding Nemo”. The teacher led the class in a close reading of the text. She referred to particular questions such as “compare” and “distinguish”, as well as strategies such as “prediction”, which she required to be checked. The following section involved discussing the character of Dory.
| T: | … Right now for the business part of the morning. Brain time. What have we learned so far about Dory’s character? Now think about it a little bit. Think what you have seen … | |
| C: | She’s over reacted more than Marlin. | |
| T: | She over reacted towards Marlin. Why do you think she did that? | |
| C: | Marlin’s scared of sharks but she just thinks it’s a party. | |
| T: |
Why do you think she’s doing that? That’s not even one of our questions [questions for discussion have been identified on a whiteboard], but it’s come up so we’re discussing it. Why do you think she’s, is not scared of the shark and she can’t understand why Marlin is scared of the shark? [looks at another child for answer] |
|
| C: | Because his baby got eaten by the shark. | |
| T: | Of course. He’s petrified of the shark because can you remember what happened on Monday? What is “petrified”? What is that word? What does it mean? [looks at another child to answer] | |
| C: | He was scared. | |
| T: | Very. Much more than scared. Extremely scared. | |
| C: | (another child) Frightened. | |
| T: | Frightened. | |
| C: | I le space [In space]. Manaia [Nice]. | |
| T: | Mai Pluto [From Pluto]. E shine le la i le moon ae reflect mai i [The sun shines on the moon and it reflects it]. | |
| T: | E scientific a? [It’s scientific isn’t it?] Lelei tele R [R is good]. |
(discussion continues)
| T: | Now here is a very hard one but you can cope with this. What would you say is the main complication in that story? Complication … narrative writing that we’re doing. What do you think is the main complication in the story? … I’m not going to tell you what complication means because we’ve discussed that when we did our narrative writing. And I want you to know that word. “C …” | |
| C: | To find Nemo. | |
| T: | The main complication. Sort of the right answer but you need to say it [in] different words. “R…”? | |
| C: | Marlin is really desperate to find his only son. | |
| T: | But what had to happen to Nemo before you could find him? So what is the complication? What is the main complication? What is the main….what is an easier word for complications [Points to a child] | |
| C: | Problem | |
| T: | Problem. What is the main problem, or the main complication here. It’s not to find Nemo, but it’s because ….? [T points to another child] | |
| C: | Nemo got caught. | |
| T: | Nemo got …? | |
| C: | [children say in chorus] Caught. | |
| T: | Caught or ….? Further discussion. | |
| C: | [Children say] Lost | |
| T: | Lost. As far as Marlin is concerned, Nemo is lost. I also think I agree with you. I think this is the main complication of the story. Okay, let’s do the next one [preselected questions]. Keep an eye on the time. I’m going to skip two and do the last one. If you were the author, what would you allow to happen next? I’ll read this question again… |
| T: | … It’s our learning outcomes or what we’re learning to do. …We’re going to extend, and another word for extend is improve our vocabulary, okay? This is mainly a vocabulary lesson. And we’re going to write our own poems with the synonyms we find. | |
| [discussion of words “vocabulary” and “synonyms”] | ||
| [Children read poem] | ||
| T: | What were you thinking about as you were reading that poem? | |
| [further discussion focussed on response to poems and synonyms] | ||
| T: | I agree with you that this is not a happy or a positive or a light hearted poem. This is a hard question. What is the deeper meaning of this poem? What do you think Pauline Cartwright’s trying to tell us in this poem? [looks at child with hand raised] | |
| C: | About war and how people die. | |
| T: | Could be. Think a little, but what um Willie said earlier on. | |
| C: | [another child] the newspaper’s horrible to read. | |
| T: | The newspaper’s horrible to read. Because look at the title of the poem. Read the title of the poem to me. [they read title] | |
| T: | My teacher said to read the newspaper so I did. Have I told you that before? To read the newspaper? | |
| C: | [all say yes] | |
| T: | So you did. So what did they find out? Horrible, sad, bad, war. Do you think all newspaper articles are about like that? | |
| C: | [all say no] | |
| T: | I’ve got a happy one here that we will read a little bit later, okay? Just to prove that not all newspaper articles are bad. Right but let’s get on with our um discussion of meanings. | |
| [children make lists of words known and not known and compare common unknown words – words include “depression”, “fascism”, “recession”, “greediness”, “neediness”] | ||
| T: | Okay so tick “inflation”. What else do you have at the bottom there? “Mourning” Hey talking about that, is there another morning? | |
| C: | [one child says] Yes miss. | |
| T: | How’s that spelt? [looks at another child] | |
| C: | m-oh m-o-r-n-i-n-g. | |
| T: | What is that? What does it mean? What does that morning mean that you have just spelt? | |
| C: | The morning right now. | |
| T: | Yeah. In the …? | |
| C: | (children say ) Morning | |
| T: | Morning. What’s short, the abbreviation for morning? | |
| C: | Morn. | |
| T: | When you see it written next to a time? | |
| C: | [two children say] A.M. | |
| T: | A.M. well done. A.M. morning. Now that “mourning” that we’ve got written on our papers … what did they add up here? They added something. | |
| C: | U | |
| T: | They added “u” and therefore the meaning changes …. | |
| [discussion of words continues with use of dictionaries and thesaurus] | ||
| T: | I just wanted you to be aware that the words they’ve written down there are all nouns okay? They changed the root words into nouns to write the poem. You don’t have to keep all your words nouns when you write your poem. Okay? It’s just so that you can understand the poem. So we’ve learnt what the deeper meaning is of the poem, we’ve seen that our poem rhymes, and that … | |
The group completed the session by jointly writing a poem: Racism is bad. Mourning is sad. Fears give you tears. War has gore. Open the doors, no more horrors and sores.
Case Study 2: Expected gain classroom
Teacher 2, who was at a different school from Teacher 1, was also a mainstream teacher in a Year 7/8 composite class, with 27 students. On average, students had made expected progress, remaining at the same stanine level at the end of the year. Their gains of component tests, shown in Table 26, were largest in decoding and in the fifth curriculum related task of identifying emotive words in a piece of persuasive writing.
Teaching in this classroom also had the attributes associated with the cluster focus in the first and second years. The teacher also had a well organised sequence of activities, using the general programme components of guided reading with ability groups and shared reading with those groups. She established clear statements of goals at the beginning of sessions. The focus on checking for evidence in the text was present both at the beginning and at the end of the year. Similarly, she had a consistent focus on vocabulary, as well as making life to text connections, trying to incorporate background event knowledge. The following sequence showing these attributes comes from a guided reading session at the beginning of the year with seven children reading an informational text about mangrove trees.
| T: | Now what we’re gonna do here, is we’re first of all gonna have a look at the first page and find out two things about these trees while we’re actually reading through it. The first thing is why they only grow in the northern part of New Zealand and why they are really different trees from most other trees. “C” can you start reading please. | |
| C: | Did you know that nga manwa [child stumbles on word] | |
| [further reading and correction of pronunciation] … | ||
| C: | Nga Manawa will only grow in the northern part of the island – the North Island. In the southern land it is too cold for them to grow. | |
| T: | Okay now, why do they only grow in the northern part of the North Island of New Zealand. | |
| [teacher selects child with hand up] | ||
| C: | [child does not answer] | |
| T: | We’ve been talking about it and it’s actually written down there on the page. Remember how I said I was going to ask you? | |
| C: | Yes. | |
| T: | Yes just to make sure you were concentrating [selects another child] | |
| C: | Because it’s warm. | |
| T: |
Yeah because it’s warmer. That’s the important thing. Because it says down the bottom, further south than this it is too cold. So it’s warmer. Now what is the other thing about these mangrove trees that makes them really special tree that’s been mentioned on the first page?[teacher selects a child] |
|
| C: | Because they can survive in um salt water. | |
| T: | Yeah that’s right. So that’s two interesting facts about it. Now have a look on that page and see if there’s any words that you don’t know what they mean. ‘M’? | |
| C: | ‘Swampy’. | |
| T: | Okay does anyone know what ‘swampy’ is? What do you think? | |
| C: | Um like where ducks live. | |
| T: | Okay so where ducks live is not a bad idea. So what kind of places do ducks live in? | |
| C: | Swamps. | |
| T: | Yeah but we’re trying to find out what that word means eh? ‘M’? | |
| C: | Can I take a guess? | |
| T: | Yeah take a guess. | |
| C: | Is it like muddy and sort of watery? | |
| T: | Yeah that’s a good thing because if you look at this (refers to illustration) that’s got a bit much water in it at the moment, but it’s sort of along the right lines. Just look on the next page. This picture here. Also, some of us went to Western Springs (a local lake). Have any of you guys been to Western Springs? At Western Springs you get kind of muddy slushy areas like that. That’s swampy. But the difference between Western Springs and where the mangroves live is that the mangroves live in …? [child puts up hand] | |
| C: | [another child answers] Salty water. | |
| T: | Yeah salty water. | |
| [Other words were discussed, such as “anchor” and “poison”, over multiple turns. For example, the word ‘Coastal’ took 13 turns] | ||
| C: | Can I ask a question? | |
| T: | Yeah. | |
| C: | Do they call mangroves around the world ‘mangroves’ or do they call it another name for it? | |
| T: | In countries where people speak English they call them mangroves. I don’t know what, I don’t know the word for mangrove in any other language at all, except Mäori which is Nga Manawa, but I don’t know in any other languages at all. You might like to ask Mrs. ‘H’ (a Samoan teacher in another class) afterwards if she knows what the word is in Samoan. She might. | |
Further examples of these attributes can be seen at the end of the year, in a guided reading session with four children reading an informational text about comets (“Shooting Through”; Connected 3 – 2003).
| T: | Oh the Orion nebula. Okay, Orion is a constellation. It’s a group of stars that are all together. Okay was there anything else anybody didn’t know what it was? | |
| C: | This one | |
| T: | Okay so let’s look at the word “occasionally”. | |
| [discussion of word for 22 turns] | ||
| C: | Evaporate | |
| T: | Okay evaporate. Anyone know what “evaporate” means? Okay where abouts is it, oh that’s in that first sentence of that paragraph isn’t it? | |
| C: | [one child] yes. | |
| T: | Okay let’s have a listen to the sentence and you have a read of it while I read it to you and we will see if we can work out what it means. As the comet nears the sun some of it evaporates and becomes a strip of dust and vapour that looks like a huge tail. So as the comet nears the sun some of it ‘evaporates’. | |
| C: | [another child] Gets longer? | |
| T: | No, that’s a good guess though cos we learnt that it did get longer. | |
| C: | {Another child] Some of them starts to fall apart. | |
| T: | You are on the right track there. | |
| C: | [another child] It changes. | |
| T: | Yeah it does change. Now when you put your clothes out on the clothes line, they’re wet aren’t they? | |
| C: | [all say yes] | |
| T: | Later on in the day unless it’s been raining you go to bring them in, what are they like? | |
| C: | [one child] Wet. [another child] soaked. | |
| T: | If it hasn’t been raining … you put them out and they’re wet right? And it hasn’t been raining all day and you go back to bring them in. | |
| C: | [one child] It’s dry. | |
| T: | It’s dry. Okay so where has the water gone? | |
| C: | [one child] Oh the sun absorbed it. | |
| T: | Okay that’s evaporates okay? It turns into steam and it disappears off up into the clouds. | |
| [Further examples of extended question and answer sequences around the unknown words (one for “thermos” of 31 turns).] | ||
Comparisons between the two teachers
In both classrooms, students made gains over a year, but in the first classroom these were substantially above expected rates, while in the second they were at expected levels. The two teachers’ patterns of exchanges were similar, and in most respects consistent with the general programme. For example, both teachers had four reading ability groups throughout the year. They programmed guided reading with at least one group per day and a shared reading session with each group at least once per week. They focused on looking for evidence and other aspects highlighted by the professional development.
However, differences in their instruction were present in three general areas. The first was in the frequency of the targeted features (Table 26). The second teacher more often used questioning to focus on new vocabulary, or when directing children to check for evidence in the texts. These frequency differences can be seen in transcript segments in which the second teacher appears to dominate the interactions, through extended sequences of questioning. The suggestion here of teacher dominance is borne out by correlations, for the nine teachers, between overall number of exchanges and mean gain scores for their classrooms. Extended teacher talk had very large negative correlations with sentence comprehension (r = 0.75, p = .02) and vocabulary (r = – 0.64, p = .06), suggesting that for these teachers, who were generally more effective than the teachers as a whole, further talk had limited benefit.
The two teachers were similar in terms of frequency of exchanges in which awareness of strategies was prompted. But the first teacher, much more often than the second teacher, was also directing the students’ awareness to the requirements of activities and task formats. She often tried to clarify her expectations of the children and the nature of the tasks they met ( e.g. “I just wanted you to be aware of the words …”).
| Teacher 1 (high gain) | Teacher 2 (expected gain) | ||||
|---|---|---|---|---|---|
| Beginning | End | Beginning | End | ||
| Total exchanges | |||||
| Text related | 24 | 40 | 26 | 34 | |
| Vocabulary questions T | 6 | 21 | 13 | 24 | |
| Vocabulary comment T | 8 | 23 | 10 | 18 | |
| Extended talk T | 13 | 17 | 13 | 18 | |
| Extended talk C | 9 | 13 | 8 | 12 | |
| Text check T | 2 | 6 | 7 | 18 | |
| Text check C | 2 | 9 | 3 | 14 | |
| Incorporation | 4 | 4 | 14 | 4 | |
| Awareness strategy | 7 | 20 | 4 | 19 | |
| Awareness other | 19 | 12 | 9 | 3 | |
| Feedback high | 21 | 25 | 21 | 23 | |
The second area is a more qualitative variation around three of the targeted areas. The transcript data show that the second teacher’s extended style of interaction involved students guessing what she was thinking about. This conflicted with monitoring threats to meaning and checking for evidence, particularly when coupled with her unqualified acceptance of students’ inferences, predictions and even guessing. While checking exchanges were quite frequent, they were relatively limited in terms of checking meanings (e.g., checking the meaning of “evaporate”). Another area of difference can be seen in the first teacher’s use and elaboration of vocabulary. Her focus was partly based on the text selection, and partly based on going beyond the text, and she introduced more complex and less familiar language, including idiomatic uses (e.g., “light hearted”), more often than the second teacher.
In addition, and consistent with the vocabulary focus, the first teacher had not just targeted words, but created a classroom community that enjoyed words, set out to identify new and interesting words, and shared their enjoyment and fascination with words. She played with words and phrases; in the first session, when elaborating the word “webbed”, she asked the class if she had “webbed feet”. Several times in the second session, she identified homophones (“mourning” and “morning”), homonyms, or words with several related meanings (“inflation”), as well as words for which end consonant shifts changed meanings (“mob” and “mop”). This latter signals an awareness that Pasifika children may have difficulty in making use of some consonants at the beginnings and ends of words. This is because the Samoan alphabet does not contain some consonants, such as ‘b’, Samoan words end in a vowel, and dropping endings in general in English, and consonant endings in particular, may be a dialectical variation in English for Samoan children (Watkins, 1976). The teacher was focusing children’s attention on critical features of words, particularly those that changed meanings. This also may illustrate one of the sources for the gains in decoding
These differences seem to imply differences in expectations of the students. The first teacher repeatedly pushed her students to think “hard” and to think about “deeper meaning”. The second teacher specifically directed children away from using more complex reference texts to “go to the skinny dictionaries first… [they are] written in simpler language”. By contrast, the first teacher directed children to use fuller dictionaries and the thesaurus. Like the first teacher, the second teacher incorporated aspects of the students’ event knowledge; but the usefulness of developing life-to-text connections was limited as an efficient strategy, because of some ambiguity created by the question and answer format, and the generally uncritical acceptance of responses (e.g., “That’s a good guess”).
A third difference is not indicated in the frequency of exchanges or in the qualities of the interactions, but rather in further aspects of the general programme revealed in interviews around the classroom observations and in follow-up sessions. The first teacher read a shared novel every day to the class for 10–15 minutes. This additional feature was consistent with the emphasis on increasing exposure to rich and varied texts, and was also consistent with the emphasis on exposure to new and unfamiliar vocabulary and language uses. In addition, the first teacher’s decision making was more evidence based. She reported using on the run assessments for planning each day, and use of guided reading as an individualised assessment procedure at the beginning and end of term to assess skills, needs and interests. The second teacher did not add a “reading to” component, and did not comment about incidental on the run assessments as a means of making decisions about children’s needs.
4. Results: Achievement in the Bilingual Classrooms
Phase 1 – Baseline profile
Achievement profile – General profile of reading comprehension
The stanine distribution of both tests (PAT and STAR) indicated that the average student in the Samoan bilingual classes experienced difficulty on these measures of reading comprehension. Figure 24 shows the stanine distribution in both tests across all year levels (overall measures are shown in Table 28). The average student in both tests scored in the “below average” (stanine 2–3) band of achievement (PAT mean=3.01, SD 1.32; STAR mean=2.72, SD 1.24). The average student was well below the average band (stanines 4–6) and was two stanines below the expected average of stanine 5, although nearly 25 percent of students were within the average, above average or superior bands of achievement (stanine 5–9).
Figure 24 PAT and STAR stanine distribution across all year levels at Baseline Time 1 for Samoan bilingual students
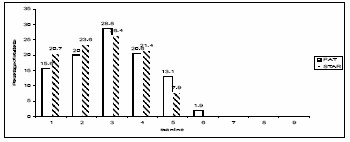
| Mean | SD | |
|---|---|---|
| PAT (N = 89) | 11.44 | 5.63 |
| Stanine | 3.01 | 1.32 |
| STAR (N = 140) | 26.79 | 12.98 |
| Stanine | 2.72 | 1.24 |
Figure 25 PAT and STAR stanine distribution across all year levels at Baseline Time 1 for Samoan mainstream students
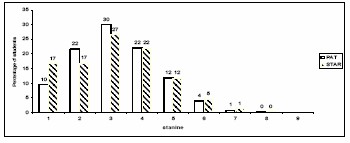
The pattern of results was similar for the Samoan students in mainstream classrooms (see Figure 25). Across year levels, the pattern was the same in both tests, with the average student in every year level scoring at stanine 3. The range of achievement was large, over stanine 1–6 in the PAT and 1–8 in STAR. This compares with 1–7 (with an outlier at 8) in the PAT, and 1–5 in STAR, for Samoan mainstream students. In contrast to students in bilingual classes, 35 percent of Samoan mainstream students were within the average, above average or superior bands of achievement (stanine 5–9).
Content analysis – PAT
As for the overall group, PAT mean scores on factual and inferential questions were identical across year levels (see Figure 26). Note that maximum raw scores for both factual items and inferential items were approximately 20 (Reid & Elley, 1991). This suggests that students experienced similar difficulties in answering factual and inferential questions. Again, as for the overall group, there was a significant correlation between factual and inferential items (r = 0.72, p < .01).
Figure 26 Mean raw scores on factual and inferential questions by year level at Baseline Time 1 for Samoan bilingual students
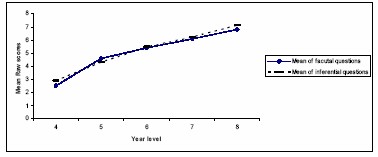
For the Samoan mainstream group, however, the pattern was somewhat different. Mean raw scores on factual and inferential questions were stable around mean scores of 5–6, and were therefore higher than bilingual student scores in the first three year levels (see Figure 27 and Table 29). This shows that bilingual students initially scored at lower levels in answering factual and inferential questions, but had caught up with their mainstream peers by Year 6.
Figure 27 Mean raw scores on factual and inferential questions by year level at Baseline Time 1 for Samoan mainstream students
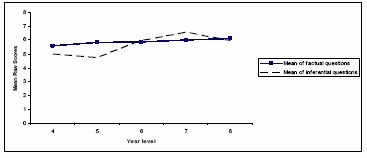
|
Year level |
N |
Factual Questions | Inferential Questions |
|
||
|---|---|---|---|---|---|---|
| Bilingual | Mainstream | Bilingual | Mainstream | |||
| 4 | 21 | 2.52 (1.40) |
5.59 (2.83) |
2.90 (1.52) |
4.99 (2.51) |
70 |
| 5 | 14 | 4.64 (2.50) |
5.85 (3.13) |
4.29 (2.64) |
4.76 (2.56) |
99 |
| 6 | 20 | 5.49 (2.68) |
5.88 (3.31) |
5.50 (2.66) |
5.99 (2.84) |
91 |
| 7 | 52 | 6.10 (2.74) |
6.00 (2.89) |
6.15 (2.67) |
6.57 (2.78) |
95 |
| 8 | 53 | 6.79 (3.23) |
6.12 (2.88) |
7.07 (3.13) |
5.99 (2.78) |
93 |
| Total | 160 | 5.64 (3.05) |
5.89 (0.17) |
5.80 (3.02) |
5.66 (0.67 |
448 |
Content analysis on the STAR sub-tests
Consistent patterns across the STAR sub-tests were found at each year level. Figures 28 and 29 (see also Table 30) show percentages correct in each subtest for Years 4–6. At every level, for both bilingual and mainstream groups, students scored highest on sub-test 1 (word recognition) and lowest on sub-test 3 (paragraph comprehension). This indicates that students in these year levels experienced more success in decoding words than in comprehending a paragraph.
Figure 28 Mean percentages obtained in each sub-test (STAR) for Years 4–6 at Baseline Time 1 (Samoan bilingual students)
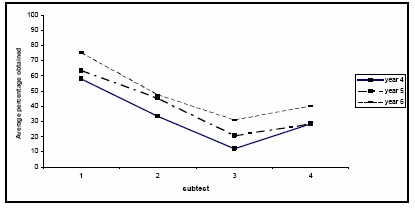
Figure 29 Mean percentages obtained in each sub-test (STAR) for Years 4–6 at Baseline Time 1 (Samoan mainstream students)
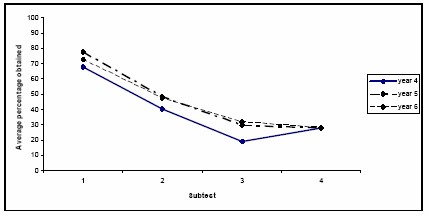
| Year level SubTest |
4 | 5 | 6 | 7 | 8 |
|---|---|---|---|---|---|
| Decoding | |||||
| SB | 57.90 | 63.50 | 75.00 | 58.10 | 69.70 |
| SM | 67.50 | 77.47 | 72.42 | 59.90 | 68.78 |
| Sentence | |||||
| Comprehension | |||||
| SB | 33.30 | 45.30 | 47.30 | 34.40 | 52.20 |
| SM | 40.40 | 48.20 | 47.30 | 30.73 | 37.58 |
| Paragraph | |||||
| Comprehension | |||||
| SB | 12.00 | 12.00 | 30.90 | 21.80 | 35.40 |
| SM | 19.03 | 29.50 | 31.84 | 26.69 | 39.50 |
| Vocabulary range | |||||
| SB | 28.34 | 28.23 | 40.01 | 38.30 | 42.70 |
| SM | 27.89 | 27.89 | 27.89 | 34.65 | 38.78 |
| Language of | |||||
| Advertising | |||||
| SB | 36.40 | 44.00 | |||
| SM | 31.03 | 36.68 | |||
| Different genres | |||||
| styles of writing | |||||
| SB | 35.40 | 45.70 | |||
| SM | 29.80 | 42.85 | |||
| Total Averages | |||||
| SB | 32.88 | 37.25 | 48.30 | 37.40 | 48.28 |
| SM | 38.70 | 45.70 | 44.86 | 35.46 | 44.02 |
SB = Samoan bilingual
SM = Samoan mainstream
There was a similarly consistent pattern for Years 7–8 in all sub-tests (see Figures 30 and 31). Students in Years 7–8 also scored highest on sub-test one (word recognition) and lowest on subtest 3 (paragraph comprehension). In addition, in the Year 4–6 age group, all sub-test scores were significantly different from each other. In the older age group, sub-test 2 and 5; 2 and 6; and 5 and 6 were not significantly different (t =0.450; t = 1.496; t =0 745 respectively) p > .05). All others were (p< .05).
Figure 30 Mean percentages obtained in each subtest (STAR) for year levels 7 – 8 at Baseline Time 1 for Samoan bilingual students
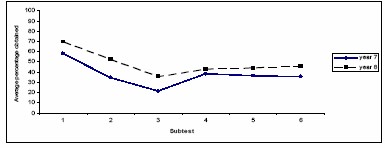
Figure 31 Mean percentages obtained in each subtest (STAR) for year levels 7 and 8 at Baseline Time 1 for Samoan mainstream students
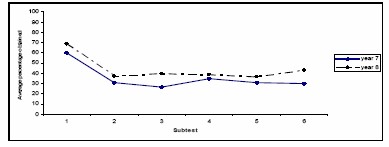
Table 30 presents the same information in tabular form. Samoan bilingual students in Years 7–8 gained higher scores than mainstream students by the same year levels in all sub-tests, except subtest 3. Like the PAT results, students in Samoan bilingual classes were initially lower on average across the whole test, but by Year 6, they were scoring significantly higher than Samoan mainstream students.
There was evidence in this profile to suggest that averages for students in bilingual classrooms were higher in sub-test 4 (vocabulary range), sub-test 5 (language of advertising) and sub-test 6 (reading different genres and styles of writing) across all year levels, compared with average percentages for the same sub-tests for Samoan mainstream students.
When the results are broken down into sub-test scores, it appears that students in the Samoan bilingual classes scored the same as Samoan mainstream students in vocabulary, and were most different in the area of paragraph comprehension. This might suggest that teachers in bilingual classrooms were focusing more on vocabulary work, as it might reflect a slower development in level 2 comprehension, specifically on connected prose.
All the sub-tests of STAR were significantly correlated (all r’s were above .30 = p< .01). A series of paired t tests between sub-tests averaged across years revealed that at both age groupings, the means for sub-test 1 were significantly higher than the means for the other sub-tests (t values > 16.04; p < .000), and sub-test 3 means were significantly lower than the means for each of the other sub-tests (t values > 12.0, p <.000).
Mean overall scores on STAR were originally higher for Samoan mainstream students at Year 4 and Year 5, but at Year 6 bilingual students had caught up. The t-tests revealed significant differences at the Year 4 and Year 5 levels between the two groups (t =0 2.303 and t =0 2.495 respectively p< .05), with effect sizes of 0.56ES and 0.77ES. There were no significant differences by Year 6, and similar averages were also found at Year 7 and Year 8. A significant difference was also noted at the overall level (t = 2.911), with an effect size of d = .20 (see Table 31).
Table 31 t–tests Between Samoan Bilingual and Samoan Mainstream Mean Overall Scores (STAR) at Baseline Time 1
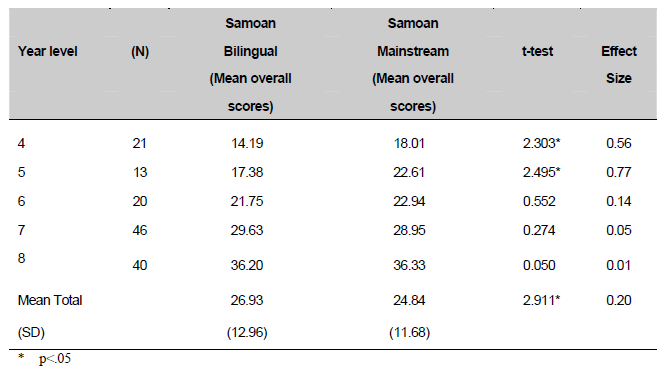
Gender
Samoan bilingual boys had lower scores than Samoan mainstream boys on both measures. Samoan bilingual girls scored higher than Samoan mainstream girls on the PAT, but not the STAR (Table 32). T-tests show no significant difference (NS) between Samoan bilingual and Samoan mainstream males on overall scores of both measures, with d = 0.16 for STAR and d = 0.19 for PAT, or between Samoan bilingual and Samoan mainstream females, with effect sizes of d = 0.15 for STAR and 0.04 for PAT (see Table 33).
| PAT | STAR | |||
|---|---|---|---|---|
| Male | Female | Male | Female | |
| (N = 72) | (N = 88) | (N = 64) | (N = 76) | |
| SB | ||||
| Mean | 2.72 | 3.75 | 2.58 | 2.91 |
| SD | (1.25) | (1.32) | (1.38) | (1.15) |
| SM | (n = 225) | (n = 252) | (n = 169) | (n = 175) |
| Mean | 3.12 | 3.31 | 2.93 | 3.45 |
| SD | (1.41) | (1.33) | (1.44) | (1.53) |
Table 33 t-tests Between Samoan Bilingual (SB) and Samoan Mainstream (SM) Mean Overall Scores and (Standard Deviations) on STAR and PAT by Gender at Baseline Time 1
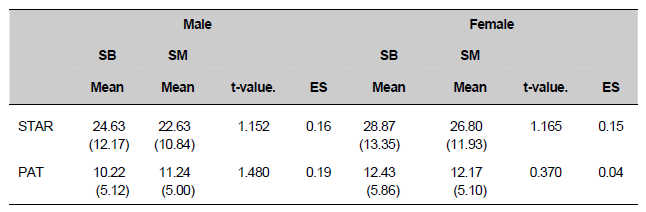
Reading comprehension outcomes
Intervention compared with no intervention
The first set of analyses concerns the overall effectiveness of the professional development intervention for the children in the Samoan bilingual classrooms compared with national distributions. The quasi-experimental design uses a baseline established cross-sectionally as a means for predicting development. This analysis is graphically presented in Figure 32, and the means and standard deviations are presented in Table 34. For each cohort, comparisons can be made between the obtained outcomes at T3, and the baseline prediction for the next year cohort at T1. Independent t tests show that three of these comparisons were significant, with effect sizes above d= 0.5. The results indicate that the intervention was generally effective, relative to the baseline predictions.
Figure 32 The Cross sectional Baseline at Time 1 and gains for Cohorts across Time 1 to Time 4
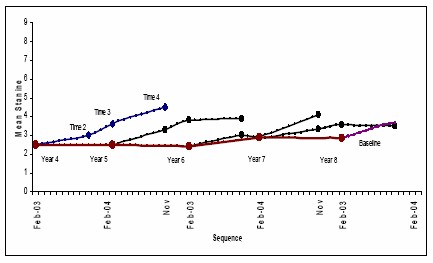
Table 34 Mean Student Achievement (and Standard Deviations) in Comprehension in Stanines Across Year Levels from Time 1 to Time 4
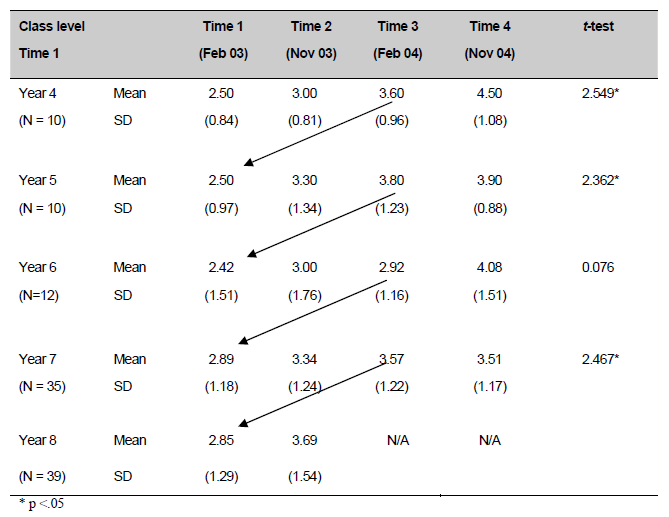
Effectiveness with different cohorts
The second approach to judging effectiveness involved looking at the gains in each of the two years. This approach examines the degree to which teachers continued to teach effectively with new classes. The results of this analysis for individual teachers are shown in Table 35. The overall gains in the two years were different, being 0.5 stanine in the first year, and 0.3 stanine in the second year. However, there were marked differences between teachers. In classrooms 1, 2 and 3, greater gains were made in the second year. In classrooms 4, 5 and 6, lesser gains or no gains took place in the second year. Teachers in the latter classes attended the professional development inconsistently, and the school reduced its commitment to the professional development in the second year.
| Gain | Gain | |||||
|---|---|---|---|---|---|---|
| T1 | T2 | T3 | T4 | T1-T2 | T3-T4 | |
| Classroom
1 |
2.74 |
3.07 |
3.80 |
4.30 |
0.4 |
0.5 |
| 2 | 2.44 | 3.04 | 2.68 | 3.60 | 0.6 | 0.9 |
| 3 | 2.45 | 2.79 | 2.57 | 3.50 | 0.3 | 0.9 |
| 4 | 3.18 | 4.17 | 3.16 | 3.20 | 1.0 | 0 |
| 5 | 1.83 | 2.05 | 3.78 | 3.43 | 0.3 | -0.4 |
| 6 | 3.39 | 3.74 | 3.27 | 3.20 | 0.3 | -0.1 |
| Total | 2.72 | 3.20 | 3.20 | 3.52 | 0.48 | 0.32 |
| (SD) | (1.24) | (1.46) | (1.44) | (1.47) | (0.75) | (1.70) |
Gains in Samoan bilingual classrooms and mainstream classrooms
Results for the third analysis of effectiveness are shown in Table 36. Reading achievement at each time is shown for cohorts of Samoan students in bilingual classrooms and in mainstream classrooms at the same schools. Three features of the data are worth noting. The first pattern, already noted, comes from the cross-sectional baseline, which shows that the children in bilingual classrooms were significantly lower in English reading achievement in Year 4 and Year 5 but from Year 6 onwards, their achievement levels were similar to those in mainstream classrooms. This may indicate that typical development for the bilingual students has been that English reading comprehension lags behind until about the sixth year of school.
The second feature is that the gains from Time 1 to Time 4 in the bilingual classrooms were at least as high as the gains in the mainstream classrooms, and in three of the year levels, they were noticeably higher. The overall gain in bilingual classes was 1.13 stanine compared with an overall gain of 0.81 stanine in mainstream classes. An independent t test shows that this comparison was not significant (t = 0.194 p >.05). The higher gains for the Samoan bilingual students did not occur only when the starting levels at T1 were lower for the bilingual classroom students, and hence cannot be attributed to some sort of ceiling effect.
The third feature is that for the students in bilingual classrooms, the intervention produced gains which meant that mean achievement by the end of the second year for the Year 4 cohort (when they were at the end of Year 5) and the end of the second year for the Year 5 cohort (when they were at the end of Year 6) was the same as the student cohorts in the comparison mainstream classrooms. These results, particularly for the Year 4 students, suggest that the typical course of bilingual students lagging behind until the sixth year at school may very well be alterable with more effective instruction. However, it should be noted that these results are for English reading comprehension only.
| Year | Gain | ||||||
|---|---|---|---|---|---|---|---|
| Level | Instruction | N | Time 1 | Time 2 | Time 3 | Time 4 | T1-T4 |
| 4 | SB | 10 | 2.50 | 3.00 | 3.60 | 4.50 | 2.00 |
| SM | 48 | 3.44 | 3.56 | 4.21 | 4.42 | 1.02 | |
| 5 | SB | 10 | 2.50 | 3.30 | 3.80 | 3.90 | 1.40 |
| SM | 45 | 3.62 | 4.11 | 4.00 | 4.02 | 0.40 | |
| 6 | SB | 12 | 2.42 | 3.00 | 2.92 | 4.08 | 1.67 |
| SM | 24 | 2.29 | 3.33 | 3.08 | 3.17 | 0.88 | |
| 7 | SB | 35 | 2.89 | 3.34 | 3.57 | 3.51 | 0.63 |
| SM | 38 | 2.63 | 3.50 | 3.76 | 3.68 | 1.05 | |
| 8 | SB | 39 | 2.85 | 3.69 | N/A | N/A | 0.84 |
| SM | 89 | 2.82 | 3.39 | “ | “ | 0.57 |
5. Discussion
What about tomorrow?
We began this report with a short history of educational research into the schools in South Auckland. In general, that evidence suggested that Mäori and Pasifika children in these decile 1 schools of South Auckland were likely to be at risk in their schools of having low achievement. A landmark study proclaimed that “tomorrow may be too late” for these children and their schools (Ramsay, Sneddon, Grenfell, & Ford, 1981).
There had been little evidence of gains in achievement in literacy since the Ramsay report until the NEMP evidence in 2001 (Flockton & Crooks, 2002). But this, and the next cycle of national assessments in 2004 (Crooks & Flockton, 2005), contained mixed messages. Although levels of fluency and accuracy of decoding had increased for Mäori and Pasifika children, comprehension levels at Year 4 and Year 8 were still low compared with other children, and the gaps might have been increasing.
This project set out to ask two general questions:
- Can a research-practice collaboration develop cluster-wide and school based professional learning communities that are able to critically analyse and problem solve issues of instructional effectiveness, thereby developing more effective instruction that has a powerful educationally significant impact on Mäori and Pasifika children’s comprehension at Years 4-9 in seven decile 1 schools?
- Can a set of effective instructional activities be identified that are able to be used by teachers to enhance the teaching of comprehension for Mäori and Pasifika children in Years 5-8 in decile 1 schools?
In addition, a specific question was asked about Samoan students and teaching in Samoan bilingual classrooms:
- Is a major reason for lower than expected achievement for Samoan students on comprehension tests in schools less than effective teaching?
Educationally significant impact?
The answer to the questions about achievement and effective teaching is that it is possible to develop more effective teaching that impacts directly on the reading comprehension achievement of Year 4–9 children. The level of gains overall was substantial, amounting to around one year’s gain (in addition to nationally expected progress) over the three years of the project.
Children who had been at the involved schools continuously for the three years made gains of 0.97 stanine, and the effect size was 0.62 (representing over half a standard deviation difference between the group’s achievement distribution at the beginning and at the end). But even when considering all the children present from the beginning to the end, including children who subsequently left and those who subsequently entered the school, either from earlier levels or as new students from other schools, the levels of achievement at the schools increased considerably. They shifted from stanine 3.1 at the beginning of 2003 to stanine 3.61 at the beginning of 2007.
We examine further below the theoretical significance of these findings. It is worth underlining here, however, what the educational significance is. The effectiveness of the teaching increased substantially. At the beginning, teaching was associated with students making expected gains across year levels in their reading comprehension. Unfortunately these students needed to make accelerated gains, because on average they were almost two years behind the expected national achievement levels. The teachers were able to do this. At the end, the students were less than a year behind the expected national levels. But more importantly, 71 percent were now in middle to upper bands of reading comprehension for their age level, compared with only 40 percent at the start. A total of 77 percent of children would be expected to be in the average or above average bands, so this represents a reduction in risk of not being in the average bands from 1.9 to 1.1.
This can be put in a more general educational context. The most general and well documented acceleration programme we have in New Zealand is associated with gains to middle levels of reading for the classroom for low progress children (McDowell, Boyd & Hodgen, 2005). It achieves this on a daily one-to-one basis for half an hour over 15 to 20 weeks. The children are aged 6, and the target is the middle band for the school, not the national average. The teaching in the programme reported here occurred in the typical classroom reading sessions, with classes of 23 to 30 students, using the usual vehicles of instruction, which include well known approaches such as guided reading and deliberate acts of teaching (Ministry of Education, 2006). More generally, in the United States Borman (2005) shows that national reforms of schools to boost the achievement of children in low performing schools serving the poorest communities have produced small gains in the short term (of the order of effect sizes of less than 0.20), but that after seven years in those few schools that sustain reforms over a long period, the effects increase (estimated to be around effect sizes of 0.50). When considered across the country, while some achievement gains have occurred, they have typically been low and need to be accumulated over long periods of time.
Given the longstanding and seemingly intractable nature of the challenge of teaching more effectively, this project marks a major breakthrough in our demonstration and understanding of effective teaching. The quasi experimental design, with its additional checks through comparisons with a similar but untreated cluster, and through testing the contribution of subject attrition, gives us considerable confidence in attributing these outcomes to the research and development programme. The design is not fully experimental, hence we cannot say without qualification that the research and development programme caused these results. But the in-built comparisons against projected levels, the replications, the patterns of change over time and the external test make it highly likely.
The research and development programme involved several components which were added together sequentially. In the following sections, we discuss the contribution of different components of the intervention, and the specific results relating to the Samoan bilingual classes.
The three phase model
Research reviews argue that effective educational interventions in general have a component which involves the collective use of evidence, typically from student achievement data, to guide and evaluate teaching practices. Similarly, effective educational interventions have a focus on instructional practices for specific aspects of student learning. The collaborative research and development programme described here involved a focused intervention incorporating both elements of effective educational interventions in a cluster of poor urban schools with communities that are both culturally and linguistically diverse. Collaboration in the first year (Phase 1) entailed the development of a professional learning community, focused on collecting, analysing and critically discussing evidence. In the second year (Phase 2), the professional development programme focused on specific aspects of the teaching of reading comprehension. Unlike some other interventions the specific practices were highly contextualised, developed directly from the profiles of teaching and learning identified in the first phase. Phase 3 involved the critical discussion of Phase 1 and the teaching targeted in Phase 2. Further professional development did not occur, but further components were added, designed to build the critical discussion around evidence through the professional learning communities within and across schools.
Large gains in achievement were associated with Phase 1. Increased gains in achievement occurred in Phase 2, demonstrating the potential for sustaining over the longer term. However, the rates of gain were both smaller and more variable than in the first year, although the effect sizes in the second year were comparable to those reported internationally for effective educational interventions (Annan & Robinson, 2005).
What was the role of the first phase, the critical analysis and discussion of evidence? The answer to the question is limited to the sequence adopted in the educational intervention, in which critical discussion preceded fine-tuning of instructional practices. As the content for fine-tuning instructional practice was deliberately based on the findings from the critical analysis of evidence, it was not possible in this research design to sequence the intervention differently. Nevertheless, given this sequence, it appears that thinking about and critically discussing the evidence at a classroom, school and cluster level accounted for a significant part of the overall gains in achievement
This finding is consistent with other studies where the critical analysis of data has been linked to sustaining gains in achievement or improving achievement (Timperley et al., 2003; Phillips et al., 2004). This is also consistent with Hawley and Valli’s (1999) review of professional development, in which they identify critical analysis as a more effective form of professional development than traditional workshop models.
What this finding in turn suggests is that the professional learning communities had the capacity to use the evidence to make changes to existing practices, prior to professional development aimed at those practices. However, they needed support from researchers to identify the locus of the changes. This is consistent with a view of teachers as having professional expertise. It suggests that when teachers engage in problem solving and theorizing about their own practices in professional learning communities, the expertise distributed through the community contributes to marked learning gains (Robinson & Lai, 2006).
This does not imply that professional development aimed at identifying and fine-tuning specific practices was not needed. Despite the substantial gains in the first phase, they were not sufficient to achieve the goal which the school communities had set: parity with national distribution of achievement levels. Moreover, there were cohorts which made the same or even higher gains in the second phase, and were only then approaching national levels in their classrooms. So it does not appear that the professional development focused on specific instructional practices was of lesser significance per se. Indeed, one possible interpretation of the results is that gains following or in addition to analysis are harder to achieve.
There are issues in these findings around the effectiveness of the professional development in the second phase, and increasing its effectiveness. The lower gains may have been due to the issue of guaranteeing the fidelity of the programme, which other writers have noted (Newman et al., 2001). It is also possible that the solutions determined collectively in the first phase were incomplete, although many of the dimensions were similar to attributes of effective teaching while others have identified (Pressley, 2001). But the professional development in the second phase was associated with additional large gains in some cohorts, indicating the usefulness of the content. One feature of the programme in the second year which was likely to be influential was the variability in engagement and curriculum delivery associated with schools in the second phase, but not the first. This suggests that the effectiveness of the professional development around instructional practices was determined by attributes of the schools. One school was clearly less effective in the second phase: most classes made small gains or actually reduced in stanine averages in the second phase, although they had made substantial gains in the first phase. This school’s results are likely to have been a consequence of its decision to withdraw all but three teachers from the professional development component in the second phase. This indicates that the improvements in achievement attained through critical analysis could not be sustained without continued involvement in the second phase, focusing on identifying and fine-tuning specific practices.
This finding highlights the importance of continuing effective leadership in schools, and an effective professional learning community, as highlighted by previous research (Timperley et al., 2003). Similarly, the results of the third phase also support the significance of the professional learning communities. The third phase deliberately added components to build the sharing of evidence of effective practice. The gain for the longitudinal cohorts was the same in the third phase as in the first phase, and noticeably larger than in the second phase.
Sustainability phase
The sustainability of school interventions has been identified as a major problem in the research literature (Coburn, 2003). The consensus is that sustaining high quality interventions depends on the degree to which a professional learning community is able to develop (Toole & Seashore, 2002), and can effectively change teacher beliefs and practices through collective inquiry into their own practices (Annan, Lai, & Robinson, 2003; Hawley & Valli, 1999; Timperley & Robinson, 2001).We predicted that across the clusters, gains would continue to be made, given the further development of a professional learning community which critically discussed evidence, and used that evidence to monitor and modify practices. We had hypothesized that attributes of these communities included being well versed theoretically, being evidential, being analytic, and being culturally located (that is, locating their knowledge of teaching in learning in the local patterns, including knowing about the strengths and resources of the students and their communities).
Our indicators for these attributes in the third phase included the continued involvement of schools in the process of critical discussion, and the designing, implementing and collective reporting of classroom based projects in the teacher led conference. In general, there was a high rate of engagement by teachers as well as leaders in the conference. The topics for projects were theoretically based, the teachers gathered and reported on evidence, they adopted an analytic stance to that evidence, and they related their analyses to the patterns of student learning and teaching in their classrooms. The evidence from the achievement data is that the intervention was sustained in the third year. Indeed, in general the rate of gain increased in the third phase, compared with the second.
This study adds to a growing body of research (e.g., Taylor et al., 2005; Timperley et al., 2003) which suggests the importance of promoting the critical analysis of evidence in schools. Further details on how such a process can be developed, and what it should look like, are contained in Robinson & Lai (2006). They present the methodology underpinning the critical analysis used in this study, and provide detailed descriptions of the analysis process. This process includes a close examination of students’ strengths and weaknesses and of current instruction, in order to understand learning and teaching needs; drawing valid inferences from the information through raising competing theories of the ‘problem’; and evaluating the evidence for these competing theories using standards of accuracy, effectiveness, coherence and improvability.
Our study, however, reveals that there are some conditions to consider when encouraging such analysis in schools. First, the findings suggest, as others have found, that such analysis is likely to be dependent on external support, in the form of collaborative research-practice-policy partnerships (e.g., Annan & Robinson, 2005; Lai et al., 2004). We need to consider how to foster such partnerships, both in terms of the kind of partnerships being developed, and the infrastructure to support the development and sustainability of such partnerships. (See Annan & Robinson, 2005; and Robinson & Lai (2006) for discussion of effective policy-research-school partnerships). Such infrastructure could be in the form of short-term projects, such as the Teaching Learning Research Initiative in New Zealand, where central government provides contestable funding for short-term projects which must involve partnerships between schools and researchers; or it could be in the term of longer-term collaborations, such as the Woolf Fisher Research Centre, an independent trust developed to improve student learning in a high poverty urban community through research-school and often policy partnerships. Neither are mutually exclusive, and policy makers need to consider how best to use different vehicles to achieve their goals.
Secondly, our findings also caution against focusing on substituting critical analysis of evidence for professional development that focuses on fine-tuning teachers’ pedagogical and content knowledge. The data suggest that a successful professional development programme may need to incorporate both elements so that the critical analysis of evidence reveals the students’ learning needs, and consequently how to fine-tune the content and pedagogical knowledge to address those needs. This is important, as there is a danger, given the recent emphasis on analysing data, that we downplay the importance of teachers’ understanding of how to teach. Analysing evidence reveals the problem, but if teachers do not have the knowledge to understand how to address the problem, the impact on student learning outcomes is limited. Conversely, developing specific content knowledge without knowing whether the content being developed matches the needs of the students is also less effective (e.g., Buly & Valencia, 2002).
Thirdly, the complexities in our data around the first three phases of professional development highlight the need for more research to better understand the locus of change in student outcomes, and the impact of schools and teachers on those changes. Most research programmes (e.g., Taylor et al., 2004) utilize some combination of critical analysis and fine-tuning of instructional practices within a variety of research-policy-practice partnerships. Far less is known about how various components of these combinations work together to explain the results with different cohorts and in different school contexts. The complexity of our findings on the locus of change suggests that we can enhance our impact if we better understand these complexities and their impact on achievement. Policy-makers need to encourage research that collects more detailed data on features of schools and cohorts which may enhance the impact of professional development.
Research-based evidence
The significance of research-based evidence to inform educational policy and practice has been a major theme in recent commentaries on improving outcomes for children (McCardle & Chhabra, 2004), and especially in the case of children with cultural and linguistic identities associated with “minority” status in poorer schools (Alton-Lee, 2003). While searching for an evidence base for effective reading instruction is important, it is also important to demonstrate that the use of that evidence can make a difference, and to understand the mediation processes in the use of that evidence.
Data on levels of achievement and students’ comprehension were collected across age levels and across the cluster of seven schools. In addition, observations of classroom practice provided details of current patterns of instruction. These two sources of evidence were fed back to school leaders and classroom teachers who, with the research team, then systematically analysed and developed hypotheses about teaching and learning needs. This process was established in the first phase, continued in the second, and augmented further in the third. This process of critical discussion and analysis of data within the school cluster was based on previous research suggesting that the critical examination of practice in collaborative groups can be effective in creating meaningful and sustainable changes in practice (e.g., Ball & Cohen, 1999; Timperley, 2003; Toole & Seashore, 2002).
The outcomes show that gathering systematic profiles of children’s achievement (McNaughton et al., 2003) and of classroom instruction provide one important mechanism for problem-solving, and this adds importantly to our understanding. Patterns in the children’s data can be married with patterns in the classroom instruction. For example, without the classroom observation data, the patterns of errors in the Cloze tests might have suggested the need for more explicit teaching of comprehension strategies (Pressley, 2002). However, the observations revealed that explicit teaching was generally present and occupied significant amounts of teaching time. Rather, the issue was more directly a problem in the purpose of using strategies, that is, constructing meaning from and enjoyment of texts, and specifically the need to use evidence within texts to support those purposes. There are some anecdotal references to this potentially being a problem in strategy instruction (Dewitz & Dewitz, 2003; Moats, 2004), but specific observations for this context were needed.
An interesting feature of the school analysis is that there were no differences in gains associated with overall initial achievement levels in schools. It might be expected that schools with initially higher achievement gains would benefit more from the analysis and feedback process, analogous to Matthew effects for individuals and groups (Bandura, 1995; Stanovich, 1986). Conversely, it might be expected that schools with lower achievement levels would make more gains because of a higher “ceiling”, meaning that it would be easier to achieve some shifts where the student body level of achievement was very low. The absence of these effects suggests that the processes of analysis and feedback were quite robust across schools.
Reading comprehension and effective teaching
The initial profile of student comprehension in the seven decile 1 schools confirmed previous descriptions of “below average” levels in the middle to upper primary school years (Flockton & Crooks, 2001; Crooks & Flockton, 2005; Hattie, 2002). The profile was the same across age levels and across the two tests used. However, it is important to note the presence of variability within the profile. A quarter of the students were average or significantly above average in their achievement.
What can be determined from the patterns within and across tests? One hypothesis was that students had not developed fast and accurate decoding skills, which are known to be a necessary—but not sufficient condition—for effective comprehension of conventional school texts (Nicholson & Tan, 1997; Pressley, 2002). The findings suggested that widespread problems with decoding skills were unlikely to be the underlying reason for the low PAT and STAR results. At every year level, the results for “word recognition” in STAR were higher than for any of the other sub-tests. On average, students got between 60 percent and 80 percent of the words correct, indicating an ability to identify words reasonably accurately under timed conditions. These means were only between 1.1 and 2 raw scores different from the means reported in the manual for the nationwide sample, indicating that word recognition skills were similar to those for the country as whole. (Elley (2001), states that only a raw score difference of 3 to 4 points can be considered significant.) Anecdotal evidence from senior managers further supports this conclusion. Senior managers in the schools reported large numbers of students scoring highly on decoding (as measured by running records), but performing poorly on the tests of comprehension, such as STAR, PAT and comprehension questions on the running records.
Further evidence to support the conclusion that most students did not have problems reading the test was found in the completion rates of the PAT. The students’ rates of completion in the PAT were relatively high, so that by Year 8, the rate of completion was 93 percent. However, this could also suggest inaccuracy and high rates of guessing. Indeed, analysis of the errors on the paragraph completion sub-test of the STAR which has a Cloze format indicated that there were high rates of guessing, or at least of not checking answers.
Two further pieces of evidence at the initial baseline stage support the proposition that over-use of predicting or guessing without checking was occurring. First, classroom observation data suggested that students often engaged in “predicting” during standard classroom reading activities. For example, in all of the guided reading lessons observed, students generated many predictions about the narrative or expository content of texts, but rarely checked (and were rarely prompted to check) the accuracy of these predictions, using evidence from the text. Systematic observations recorded prompting to check predictions only nine times in 16 hours of observations. Recent research evidence has begun to describe a similar pattern for at least some low achieving students. Dewitz and Dewitz (2003) described a small group of fifth grade readers who were fast, efficient decoders, but had low comprehension scores. Error analysis revealed high rates of errors termed “excessive elaborations” (i.e. guessing).
A surprising finding was that the students generally were not better at factual questions than at inferential questions. Previous research on family literacy practices for Samoan and Tongan children shows that many children are experienced in recitation of texts (McNaughton, 1995), which suggests that recall of facts might be a strength. One possible explanation for this discrepancy relates to the pattern of guessing noted above; if students’ strategies were focused on predicting (guessing), and not checking answers, low accuracy rates for both types of questions could be expected. A further possibility is that the students do not have the lexical range in English required for these tests. Results for the STAR sub-test which tests vocabulary range were low. Buly and Valencia (2002) found, in their sample of fourth grade low progress children in Washington State, that many of the children for whom English was a second language had difficulties with word meanings on the English tests.
Running through all of the results is the potential for students’ capabilities in comprehending to have been systematically under-assessed, because of the nature of the texts and the tests. This is a matter of the cultural familiarity or appropriateness of the tests (Luke, Woods, Land, Bahr & McFarland, 2002). The event knowledge required as background by texts, and the procedural and linguistic knowledge required by testing formats, need careful analysis for bias, because background knowledge is such a strong determinant of comprehension (Pressley, 2002). For example, it might be assumed that Polynesian and Mäori children would perform better on the passages in the PAT that are based on Mäori ‘myths and legends’. This was not the case; the lowest two mean scores on PAT passages were for the Mäori legends.
There are at least two reasons for this. One is that such passages are based on tribal Mäori cultural knowledge, and the majority of the children, being urban Pasifika and Mäori may not have had wide access to or experience with these concepts or frameworks. Luke et al. (2002) make the point that cultural groups tend to be homogenized by test developers, and there may be wide differences in practices and experiences between groups that relate to school tasks. A second is that the structure of retold legends might create a more difficult genre than a standard narrative or exposition in school texts (Graesser, McNamara & Louwerse, 2003).
Given this initial pattern, what do the analyses of classroom instruction over the course of the intervention suggest about effective instruction? Other interventions that are theory driven and have components of collaborative problem solving and fine-tuning of practices based on expert use of evidence have demonstrated gains in reading comprehension (Taylor, Pearson, Peterson & Rodriguez, 2005). We too have shown that an intervention with these components can be effective in raising levels of achievement (McNaughton, Lai, MacDonald, & Farry, 2004).
However, the position we have adopted is that while general relationships between instruction and what students learned over the course of the intervention could be assumed, there would be specific relationships and needs for this particular context. Close examination of these relationships contributes to the twin challenges of applying research-based knowledge to school practices (Pressley, 2002), and the need to continue to tease out attributes of effective instruction with diverse students (Sweet & Snow, 2003).
What we have found, in part, confirms an already substantial body of generalisable findings. For example, word knowledge can be increased and extended through specific attributes of instruction. Experimental work demonstrates that instruction embedded in texts which provides elaborations of word meanings, and repeated exposure to and use of these, increases acquisition of targeted words. There is some evidence too for generalised effects of specific vocabulary instruction (Penno, Wilkinson & Moore, 2002). In the present study, general increases in exchanges which targeted new or unfamiliar words in texts, and which involved extended discussion between teachers and students, were associated with increases in vocabulary knowledge on the standardised test.
What the present study adds is that this relationship can be employed in a multicomponent programme of teacher change, and also achieve detectable generalisable effects. The most effective teacher used her selection of texts and specific attributes of interactions to achieve these effects. Importantly, what appeared to distinguish her from a less effective teacher was her own use of a wide and complex vocabulary, as well as her expectations that this complexity was appropriate for her students. In other words, just as in early language development, there are important issues of quality of language use, such as complexity and type of vocabulary, as well as matters of frequency or repetition of language use, that all need to be considered on the input side (Hart & Risley, 1995).
A solid research base provides considerable evidence for the significance of developing strategies (Pressley, 2002). But what was not initially anticipated from that research base was the specific problem with strategy instruction to do with evidence that we found in this context. Having searched the literature, we note that previous commentators have signalled that this could be a problem with strategy instruction (Baker, 2002; Moats, 2004). The problem is likely to derive from the tendency for instructional packages to be presented and then deployed in a formulaic way, as routines to be run off, rather than as strategic acts whose use and properties are determined by the overarching goal: to enable readers to construct and use appropriate meanings from texts (Pressley, 2002). The increased focus on checking over the intervention was associated with the gains in component tests, including paragraph comprehension. Our hypothesis is that maintaining the focus on using texts to clarify, confirm or resolve meanings, and avoiding the risk of making strategies ends in themselves, may be particularly important to the continued effectiveness of strategy instruction in this context.
The solution to this risk lies in the collective evidence-based problem solving and the increased knowledge teachers developed to understand the nature of comprehending, learning and teaching, and the characteristics of effective teaching. These are features of effective programmes that have been identified by other researchers too (Taylor, Pearson, Peterson & Rodriguez, 2005). More generally, this carries implications for the features of effective teacher education and professional development. The issue here is the balance between teachers learning and carrying out predetermined patterns of instruction which are known to be effective, or developing as experts with a body of knowledge and practices, who can use and modify known instructional practices to solve issues of effective practice (Robinson & Lai, 2006). The intervention examined here initially found teachers who generally were using strategy instruction in a formulaic way, but who could develop more effective practices when armed with a more articulated theoretical base, and the use of evidence to judge effectiveness within their classroom, school and school cluster (see McNaughton et al., 2004).
A body of evidence demonstrates that effective comprehension of school texts and effective learning from school texts is dependent on the learner developing awareness, in the sense of monitoring of and control over performance (Guthrie & Wigfield, 2000). The generalised significance of this feature for classroom learning, especially for culturally and linguistically diverse students, has been argued by a number of researchers (e.g., McNaughton, 2002). Developing greater awareness of the requirements of literacy instruction, and the relationships between current knowledge and these requirements, was a component in a previous study of culturally and linguistically diverse students in beginning instruction (Phillips, McNaughton & MacDonald, 2004). In that study, instruction focused on the need for Year 1 students to develop more awareness of the goals and requirements of beginning literacy tasks, and also awareness of what they currently knew and were able to do in relationship to those requirements.
The present study also included this component. In general, the gains across the three years provide further support for this claim. An indication of this significance was contained in the case studies. They showed how this dimension distinguished between the highly effective teacher and the less effective teacher, with the former being very clear about specific goals and expectations for being able to solve complex tasks. In general, all the teachers provided a high frequency of informative feedback. But what distinguished the “high gain” teacher was the degree to which the feedback was used formatively, in a way which did not simply affirm or accept student responses. Hattie (1999) has argued that uncritical acceptance of student responses is a feature of New Zealand classrooms, and these data appear to support his contention. The data appear to support the prediction from this that students’ learning would be enhanced if the adequacy of responses was made clear, and grounded in evidence that students could access and check themselves. Coupled with this is how feedback might convey the expectation of students being able to succeed with difficult tasks, an important component in the development of self efficacy (Guthrie & Wigfield, 2000).
The concept of guidance carried in discourse patterns is central to our design of effective comprehension instruction (Pressley, 2002). What has been signalled here again is that there is something like a curvilinear relationship between attributes of guidance, and effectiveness of instruction. It is possible to have too much, just as it is possible to have too little, both at one point in time and over time. The case studies illustrate this, for example around the functions of questioning and the risk of teacher dominance (Cazden, 2001). Certainly, the general concept of planning for dynamic changes in guidance to support growing independence draws attention to the risk of too much. But this understanding needs constant application, with teachers monitoring the degree to which their moment by moment interactions do or do not support more complex forms of engagement, and this is related closely to the assumptions that they have about the capabilities of children.
A relationship that was not well clarified concerns the use of students’ cultural and linguistic backgrounds in instruction. Overall, a small but noticeable proportion of teachers’ exchanges incorporated aspects of students’ event knowledge and skills. The evidence for effective teaching being very sensitive to and capitalising on backgrounds as resources seems clear, especially in the context of culturally and linguistically diverse students (Alton-Lee, 2004; McNaughton, 2002). The presence of this process is consistent with the significance of teachers making connections for the students. Within a well managed structure, exchanges that were not planned took place, but these mini lessons were highly contingent on knowing about students’ knowledge and skills, and on the teacher being expertly placed to make connections for the students between current knowledge and needed knowledge.
The relationships are not simple. As with guidance more generally, there is a set of balances here. One is between enhancing the match between backgrounds and activities by redesigning activities to incorporate cultural and linguistic resources, and developing increased awareness of classroom requirements, including the mismatch between current expertise and classroom instruction (Phillips, et al., 2004). In the current study, it is not apparent what the appropriate balance might be. Whether further gains could have been achieved with increases in this attribute of teaching is not known. What is indicated is that the use of cultural and linguistic resources does not necessarily increase as a function of increasing the range of instructional strategies for reading comprehension per se.
The highly effective teacher looked very similar to the less effective teacher in this respect. But what distinguished the first teacher was the balance between this, and developing her students’ awareness of the goals of classroom activities and formats (including her own expectations). Her transcripts show her as more successful in creating bridges between existing background knowledge, and the requirements of classroom activities. She knew her children very well, including the likely areas where decoding could be a problem, and could judge the usefulness of referring to or activating particular event knowledge. At one point in the second session, discussing the word “mob”, she responds to children offering “gang” by agreeing that it could be a synonym for “mob”, and to another child’s reference to a local gang—“The Mongrel Mob”. Offers to complete the poem described above included children saying in the final line, “Thanks to the Lord” (accompanied by much laughter). She said they could add that line, realising they were incorporating a well-known line from church texts, with an edge of self mockery. Interestingly, the use of backgrounds knowledge was not limited to that of the students. The teacher shared aspects of her own background, and made connections with texts. When elaborating the word “gore” and its dictionary definition, “Bloodshed from a wound”, she referred to her own son’s experience on a movie set, something the children were clearly familiar with. She said “He’s in that Hercules movie. And he was telling me last night when he came home that they had fighting scenes, okay? And he said to me, there was so much, he said so much bloodshed and gore. And it’s all on the movie set …..”
The need for exposure to and extensive practice with core text-based activities is also well documented (Guthrie & Wigfield, 2000; Pressley, 2002; Stanovich, Cunningham, Cipielewski, & Siddiqui, 1996). The descriptions from this study once again highlight this need at various levels of teaching, from the selection and use of a variety of suitable texts and classroom management that maximises engagement with these texts, through to interactions during text-based activities which increase involvement in and learning from the activity. But a further pay-off for increased exposure to texts is indicated in these data. The baseline analyses had shown that levels of accuracy of decoding were not a major problem in general for the students. Decoding problems, therefore, were not targeted in the instruction. What is interesting to note is that despite this, levels of decoding as measured on the standardised test were affected positively by the instruction focused on text reading. Other researchers have found this relationship, where an intervention targeted on comprehension and based on text-based activities also impacted on decoding (Lefevre, Moore & Wilkinson, 2003).
There is one further hypothesis that has emerged for us out of these patterns. Partly it is based on the finding of the lower rate of gain in paragraph comprehension in the second year, and partly on the potential for teacher dominance in the instructional data. It is also suggested by the highly effective teacher’s use of texts and language. There might be a ceiling on the effects of specific comprehension instruction, especially in the context of a long-term professional development programme which has changed teacher behaviour and increased achievement substantially. The hypothesis we want to explore in ongoing research is that given the presence of some criterion level in being able to provide specific guidance, further gains depend on two other attributes of teaching. One is knowing when to reduce instructional input; the second is the teacher’s expertise as a teacher of English, rather than as a teacher of reading comprehension. The latter concern is about capabilities to extend the amount and range of advanced levels of text reading for students, where guidance is increasingly focused on literature and language study as primary purposes.
These descriptions contribute to meeting the research and development need which was identified by Pressley (2002) as applying knowledge to teaching contexts, and by Sweet and Snow (2003) as filling more gaps in our research knowledge. In our view, the application problem requires a view of instructional principles as needing to be designed to fit context specific needs. These needs are created by past histories of schooling and contemporary profiles. The descriptions provided here contribute to the research problem by supporting and extending our understanding of the basic attributes of effective teaching of reading comprehension.
Bilingual classrooms
Three approaches were used to judging the effectiveness of the educational intervention in the Samoan bilingual classrooms. The first shows that when a difference was made in existing teaching practices, there were changes in student achievement, relative to achievement under the standard conditions. In the United States, there is some evidence for effective instruction in bilingual classrooms in this sense of making a difference, compared with typical approaches to teaching. The interventions typically have the quality which Newman, Smith, Allensworth and Bryk (2001) call “instructional programme coherence”. This set of attributes includes a common instructional framework for teaching literacy across all schools involved in the programme; teachers working together to implement the common programme over a sustained period of time; and assessments which are common across time. They rely on long-term partnerships between schools and external support organisations; the development of a common framework for literacy diagnosis which every teacher has to implement; expected collaboration between teachers; and joint decision-making around assessments to use and the like. These attributes were present in the study reported here (see Chapter 3). Teachers collaborated with researchers and professional developers to co-construct the professional development, with the aim of sustainable improvements in student achievement. This was based on the collection, analysis and discussion process that took place in the context of collective analytic and problem solving skills (Lai, McNaughton, MacDonald, & Farry, 2004). However, there were differences between schools in participation that were likely to have impacted on coherence.
The second set of analyses showed that gains could be sustainable with new cohorts of students, which is a major challenge in developing more effective teaching (Coburn, 2003). But as for other studies in mainstream schools, the pattern of results, particularly in the second year, indicates that the role of school leadership and the sustaining of a school-based professional learning community are conditions for maintaining gains (Coburn, 2003; Hawley & Valli, 1999; Timperley et al., 2003).
The third approach to judging effectiveness showed that students in bilingual classrooms gained as much, if not more, from the changes in teaching practices as students in mainstream classes. These students were in classes taught by teachers who were involved in the educational intervention, but who were also teaching with bilingual programmes. So these comparisons are under common conditions of intervention. The results suggest that the typical developmental pattern for students in bilingual classrooms, of reading comprehension in English lagging behind that of students in mainstream classes, may be more modifiable than previously suspected (Garcia, 2003; Tabors & Snow, 2001).
Each of the three approaches to judging effectiveness showed that the educational intervention had impacted on student achievement. They demonstrated that the typical lower achievement pattern for Pasifika students in general (Crooks & Flockton, 2005; Flockton & Crooks, 2001), and Samoan students in bilingual classes in particular (as shown in their stanine averages at baseline), is neither inevitable nor immutable. This demonstration is significant, because it provides an answer to the question of where best to have an impact on achievement. Recent research syntheses of achievement in New Zealand classrooms show that while family background variables account for a significant amount of the variance in student achievement, teacher/class level effects account for up to 60 percent of the variance, depending on the subject area, level of schooling and outcome of interest, while school effects are relatively modest (Alton-Lee, 2004). The findings here add to the general sense that changing teaching practices can have marked effects.
But there are two provisos to this conclusion. One is that while student achievement levels had increased markedly by the end of the second year, the distributions were generally still below nationally expected distributions. A second proviso is that these results are for reading comprehension in English. The evaluation of the effects of interventions such as these needs also to consider the effects on bilingual and biliteracy development (Garcia, 2003). There is some research evidence from New Zealand that a high quality literacy programme in English can be associated with reduced development in Samoan language and literacy (Tagoilelagi-Leota, McNaughton, MacDonald & Farry, 2005).
Footnotes
- Stanines are normalized standard scores having a mean of five and a standard deviation of about two (Reid & Elley, 1991). They are expressed as a scale of nine units with a low of one and a high of nine. In the PAT manual, stanine nine is described as “superior”, stanine seven and eight as “above average”, stanine four to six as “average”, stanine two and three as “below average” and stanine one as “low” (Reid & Elley, 1991, p. 23). The nine stanine units may be considered as nine categories of reading attainment, making it “highly suitable for interpreting performance on the PAT: Reading” (Reid & Elley, 1991, p.23).↑
- Two years of this project were funded by the TLRI initiative. ↑
- Over the three phases, 1 student increased from stanine 1 to stanine 2 and the other student increased from stanine 4 to stanine 6.↑
- Of note is that the effect sizes for raw scores are often more than double that of the stanine scores. The effect size for stanine scores is 0.62 on average (between 0.36 and 0.76), and on average for raw scores 2.00 (between 2.16 and 2.59)4. The difference is because the stanine effect size shows the effect of the intervention when the scores have been grouped into bands (4-10 raw score points in each band) and age adjusted against national norms. This provides information on the size of the effect adjusted against nationally expected progress, in short, the effect size for accelerations in achievement. By contrast, the raw score effect sizes shows the effect of the intervention without adjustments against national norms,↑
- Based on estimations from stanine gain. ↑
References
Alton-Lee, A. (2003). Impact of teachers and schools on variance in outcome. Unpublished paper. Wellington: Ministry of Education.
Alton-Lee, A. (2004). A Collaborative knowledge building strategy to improve educational policy and practice: Work in progress in the Ministry of Education’s Interative Best Evidence Synthesis Programme. Paper presented for a symposium at the annual conference of the New Zealand Association for Research in Education, Wellington, 25 November 2004.
Annan, B. (1999). Strengthening education in Mangere and Otara. Summary of the SEMO annual report: The evolution of a 3-way partnership, schooling and development project. Wellington: Ministry of Education.
Annan, B., Lai, M. K., & Robinson, V. M. J. (2003). Teacher talk to improve teacher practices. set: Research Information for Teachers, 3 (1), 35.
Annan, B., & Robinson, V. (April, 2005). Improving learning processes for practitioners involved in school reforms. Paper presented at the American Educational Research Association conference, 11 to 15 April, Montreal, Canada.
Awatere-Huata, D. (2002). The Reading race. How every child can learn to read. Wellington: Huia Publishers.
Baker, L. (2002). Metacognition in comprehension instruction. In C. C. Block and M. Pressley (Eds.), Comprehension Instruction: Research-based best practices (pp. 7–95). New York: The Guilford Press.
Ball, D., & Cohen, D. (1999). Developing practice, developing practitioners: Toward a practice based theory of professional education. In G. Sykes & L. Darling-Hammond (Eds.), Teaching as the learning profession: Handbook of Policy and Practice (pp. 3–32). San Francisco. Jossey Bass.
Bandura, A. (Ed.) (1995). Self-efficacy in changing societies. New York: Cambridge University Press.
Biemiller, A. (1999). Language and reading Success. Cambridge, MA: Brookline Books.
Biemiller, A. (2001). Teaching vocabulary: early, direct and sequential. American Educator Spring, 2001. Retrieved from: www.aft.org/american_educator/spring2001/vocab.html.
Bishop, R. (2004). Te kotahitanga Retrieved from: www.minedu.govt.nz/goto/tekotahitanga.
Block, C. C., & Pressley, M., (Eds.) (2002). Comprehension instruction: Research-based best practices. New York. Guildford Press.
Borko, H. (2004). Professional development and teacher learning: Mapping the terrain. Educational Researcher, 33 (8), 3–15.
Borman, G. D. (2005). National efforts to bring reform to scale in high-poverty schools: Outcomes and implications. In L. Parker (Ed.), Review of Research in Education, 29. Washington DC: American Educational Research Association.
Brown, A. L. (1997). Transforming schools into communities of thinking and learning about serious matters. American Psychologist, 52 (4), 399–413.
Bruno, J. E., & Isken, J. A. (1996). Inter-intraschool site student transiency: Practical and theoretical implications for instructional continuity at inner city schools. Journal of Research and Development in Education, 29 (4), 239–252.
Buly, M. R., & Valencia, B. W. (2002). Below the bar: Profiles of students who fail state reading assessments. Educational Evaluation and Policy Analysis, 24 (3), 219–239.
Cazden, C. (2001). Classroom discourse (2nd ed.). Portsmouth NH: Heinemann.
Chatterji, M. (2005). Achievement gaps and correlates of early mathematics achievement: Evidence from the ECLS K–first grade sample. Education Policy Analysis Archives, 13 (45).
Clay, M. M. (2002). An observation survey of early literacy achievement (2d ed.). Auckland: Heinneman.
Coburn, C. E. (2003). Rethinking scale: Moving beyond numbers to deep and lasting change. Educational Researcher, 32 (6), 3–12.
Cohen, J. (1988). Statistical power analysis for the behavioral sciences. Hillsdale, NJ: Lawrence Erlbaum & Associates.
Crooks, T., & Flockton, L. (2005). Reading and speaking assessment results 2004. National Education Monitoring Report 34. Dunedin: Educational Assessment Research Unit.
Currie, G. A. (1962). The report of the New Zealand commission on education in New Zealand. Wellington: Government Printer.
Darling-Hammond, L., & Bransford, J. (Eds.) (2005). Preparing teachers for a changing world. San Francisco: John Wiley.
Delpit, L. (2003). ‘Educators as “Seed people” growing a new future’. Educational Researcher, 32 (7), 14–21.
Department of Education. (1930). New Zealand Education Gazette. Wellington: Department of Education. Teachers and teaching:
Dewitz, P. & Dewitz, P. K. (2003). They can read the words but they can’t understand: Refining comprehension assessment. The Reading Teacher, 56 (5), 422–435.
Dyson, A. H. (1999a). Transforming transfer: Unruly students, contrary texts and the persistence of the pedagogical order. In A. Iran-Nejad & P. D. Pearson (Eds.), Review of Research in Education, 24. Washington DC: American Educational Research Association.
Elley, W. B. (1991). Acquiring literacy in a second language: The effects of book based programs. Language Learning. 41 (3), 375–411.
Elley, W. (1992). How in the world do children read? New York: International Association for the Evaluation of Educational Achievement.
Elley, W. (2001). STAR Supplementary test of Achievement in Reading: Years 4-6. Wellington: New Zealand Council for Educational Research.
Elley, W. (2005). On the remarkable stability of student achievement standards over time. New Zealand Journal of Educational Studies 40, (1 & 2), 3–23.
Elley, W. B., & Croft, A. C. (1989). Assessing the difficulty of reading materials: The noun frequency method (Rev. ed.). Wellington: New Zealand Council for Educational Research.
Flockton, L. (2003). Nationally speaking: Examining the NEMP data. Keynote address to the Learning Media National Literacy Symposium, Wellington, 19 to 20 June 2003.
Flockton, L., & Crooks, T. (2001). Reading and speaking: Assessment results 2000 (National Education Monitoring Report (NEMP) 19). Dunedin: Otago University for the Ministry of Education.
Flockton, L., & Crooks, T. (2002). Writing assessment results 2002 (National Education Monitoring Report). Wellington: Ministry of Education.
Garcia, G. E. (Ed.). (2003). The reading comprehension development and instruction of English-language learners. New York: Guildford Press.
Graesser, A. C., McNamara D. S., & Louwerse, M. M. (2003). What do readers need to learn in order to process coherence relations in narrative and expository text. In A. P. Sweet & C. E. Snow (Eds.), Rethinking reading comprehension (pp. 82–98). NewYork: Guilford Press.
Guthrie, J. T., & Wigfield, (2000). Engagement and motivation in reading. In M. L. Kamil, P. B. Mosenthal, P. D. Pearson, & R. Barr (Eds.). Handbook of Reading Research: Volume III (pp. 403-422). New York: Lawrence Erlbaum & Associates.
Hart, B., & Risley, T. R. (1995). Meaningful differences in the everyday experience of young American children. Baltimore: Paul Brookes.
Hattie, J. (1999). Influences on student learning. Paper presented at the Inaugural lecture: Professor Education, University of Auckland, 2 August 1999.
Hattie, J. (2002). What are the attributes of excellent teachers? Paper presented at the New Zealand Council for Educational Research conference, Wellington, October 2002.
Hawley, W. D., & Valli, L. (1999). The essentials of effective professional development: A new consensus. In L. Darling-Hammond & G. Sykes (Eds.), Teaching as a learning profession (pp. 127–150). San Franscisco: Jossey-Bass.
Hunn, J. K. (1961). Report on the Department of Mäori Affairs: with statistical supplement. Wellington: Government Print.
Lai, M. K., McNaughton, S., MacDonald, S., & Farry, S. (2004). Profiling reading comprehension in Mangere schools: A research and development collaboration. New Zealand Journal of Educational Studies 39(2), 223-240.
Lai, M. K., McNaughton, S., MacDonald, S., Amituanai-Toloa, M., & Farry, S. (2006). Replication of a process. Paper presented at the American Educational Research Association conference, 9 to 14 April, San Franscisco.
Lai, M. K., MacDonald, S., Hall, A., Cunningham, B., McKee, D., Nicholls, J., Reeves, J., Swann, J., Valgrave, D., Weir, P., & Warren, S. (2003). Profiling reading comprehension in Mangere Schools: A research and development collaboration. Paper presented at the joint conference of the Australian Association for Educational Research and the New Zealand Association for Educational Research, Auckland, 29 November to 3 December 2003.
Learning Media. (2003). Good thinking: Comprehension and critical thinking in the classroom. Learning Media national literacy symposium, Victoria University, Wellington.
Lee, C. D. (2000). Signifying in the zone of proximal development. In C. Lee & P. Smagorinsky (Eds.), Vygotskian perspectives on literacy research: Constructing meaning through collaborative inquiry (pp. 191–225). Cambridge: Cambridge University Press.
Lefevre, D. M., Moore, D. W., & Wilkinson, I. A. G. (2003). Tape-assisted reciprocal teaching: cognitive bootstrapping for poor decoders. British Journal of Educational Psychology, 73, 37–58.
Literacy Experts Group. (1999). Report to the Secretary for Education. Wellington: Literacy Experts Group.
Literacy Taskforce. (1999). Report of the Literacy Taskforce. Wellington: Ministry of Education.
Luke, A., Woods, A., Land, R., Bahr, M., & McFarland, M. (2002). Accountability: Inclusive assessment, monitoring and reporting. Research Based Report prepared for the Indigenous Education Consultative Body, Brisbane, August 2002. School of Education, University of Queensland.
McCall, R. G., & Green, B. L. (2004). Beyond the methodological gold standards of behavioural research: Considerations for practice and policy. Social Policy Report. Giving Child and Youth Development Knowledge Away, 18, (2). Society for Research in Child Development.
McCardle, P., & Chhabra, V. (2004). The voice of evidence in reading research. Baltimore: Brookes Publishing.
McDonald, S. K., Kessler, V. A., Kaufman, N. J., & Schneider, B. (2006). Scaling-up exemplary interventions. Educational Researcher, 35 (3), 15–24.
McDowell, S., Boyd, S., & Hodgen, E. (2005). Evaluation of the effectiveness of Reading Recovery particularly for Mäori and Pasifika students (2004-2005). Wellington: New Zealand Council for Educational Research.
McNaughton, S. (1999). Developmental diversity and literacy instruction over the transition to school. In J. S. Gaffney & B. J. Askew (Eds.), Stirring the waters: A tribute to Marie Clay (pp. 3–16). Portsmouth, NH: Heinemann.
McNaughton, S (2000). Submission to the Education and Science Committee on ‘The Inquiry by the Education of Science Committee into the teaching of reading.’
McNaughton, S. (2002). Meeting of minds. Wellington: Learning Media.
McNaughton, S. (2003). Searching for pearls of wisdom: A developmental perspective on the PIRLS results. Paper presented at the joint conference of the Australian Association for Research in Education and the New Zealand Association for Research in Education, Auckland, 29 November to 3 December 2003.
McNaughton, S., Lai, M., MacDonald, S., & Farry, S. (2004). Designing more effective teaching of comprehension in culturally and linguistically diverse classrooms in New Zealand. Australian Journal of Language and Literacy, 27 (3), 184–197.
McNaughton, S., & MacDonald, S. (2004). A quasi-experimental design with cross-sectional and longitudinal features for research-based interventions in educational settings. Manuscript submitted for publication.
McNaughton, D., Phillips G. E., & MacDonald, S. (2003). Profiling teaching and learning needs in beginning literacy instruction: The case of children in “low decile” schools. New Zealand Journal of Literacy Research, 35 (2), 703–730.
Ministry of Education. (2005). Making a bigger difference for all students. Mangaia He hurahi hei whakarewa ake i nga tauira katoa. Schooling Strategy 2005-2010. Wellington: Ministry of Education.
Ministry of Education. (2006). Effective literacy practices in years 5 to 8. Wellington: Learning Media.
Moats, L. C. (2004). Science, language, and imagination in the professional development of reading teachers. In P. McCardle & V. Chhabra (Eds.), The voice of evidence in reading research (pp. 269–287). Baltimore: Brookes.
Nash, R., & Prochnow, J. (2004). Is it really teachers? An analysis of the discourse of teacher effects on New Zealand educational policy. New Zealand Journal of Educational Studies, 39 (2), 175–192.
New London Group. (1996). A pedagogy of multiliteracies: Designing social features. Harvard Educational Review, 66, 60–92.
Newman, F. M., Smith, B., Allensworth, E., & Bryk, A. S. (2001). Instructional program coherence: What it is and why it should guide school improvement policy. Educational Evaluation and Policy Analysis, 23 (4), 297–321.
Nicholson, T. (2000). Reading the writing on the wall: Debates, challenges and opportunities in the teaching of reading. Palmerston North: Dunmore Press.
Openshaw, R., Lee, G., & Lee, H. (1993). Challenging the myths: Rethinking New Zealand’s educational history. Palmerston North: Dunmore Press.
Paris, S. G. (2005). Reinterpreting the development of reading skills. Reading Research Quarterly, 40 (2), 184–202.
Paris, S. G., & Stahl, S. A. (Eds.) (2005). Children’s reading comprehension and assessment. Mahwah, NJ: Lawrence Erlbaum & Associates.
Penno, J. F., Wilkinson, I. A. G., & Moore, D. W. (2002). Vocabulary acquisition from teacher explanation and repeated listening to stories: Do they overcome the Matthew Effect? Journal of Educational Psychology, 94 (1), 23–33.
Phillips, G., McNaughton, S., & MacDonald, S. (2001). Picking up the pace: Effective literacy interventions for accelerated progress over the transition into decile 1 schools. Final Report to the Ministry of Education on the Professional Development associated with the Early Childhood Primary Links via Literacy (ECPL) Project. Auckland: The Child Literacy Foundation and the Woolf Fisher Research Centre.
Phillips, G., McNaughton S., & MacDonald, S. (2004). Managing the mismatch: Enhancing early literacy progress for children with diverse language and cultural identities in mainstream urban schools in New Zealand. Journal of Educational Psychology, 96 (2), 309–323.
Pogrow, S. (1998). What is an exemplary program, and why should anyone care? A reaction to Slavin and Klein. Educational Researcher, 27 (7), 22–29.
Pressley, M. (2000). What should comprehension instruction be the instruction of? In M. L. Kamil, P. B. Mosenthal, P. D. Pearson, & R. Barr (Eds.), Handbook of Reading Research , Vol. III (pp. 545–561). Mahwah NJ: Lawrence Erlbaum & Associates.
Pressley, M. (2001). Comprehension instruction: What makes sense now, What might make sense soon. Reading Online, 5 (2). Retrieved from, http://www.readingonline.org/articles/ art index.asp?H REF=/articles/handbook/pressley/index.html.
Pressley, M. (2002). Comprehension strategies instruction: A turn-of-the-century status report. In C. C. Block & M. Pressley (Eds.), Comprehension instruction: Research-Based best practices. (pp. 11–27). New York: Guilford Publications.
Ramsay, P. D. K., Sneddon, D. G., Grenfell, J., Ford, I. (1981). Tomorrow may be too late. Final report of the Schools with Special Needs Project. Hamilton: University of Waikato.
Raudenbush, S. W. (2005). Learning from attempts to improve schooling: The contribution of methodological diversity. Educational Researcher, 34 (5), 25–31.
Reid, N. A., & Elley, W. B. (1991). Revised Progressive Achievement Tests: Reading Comprehension. Wellington: New Zealand Council for Educational Research.
Risley, T. R., & Wolf, M. M. (1973). Strategies for analyzing behavioral change over time. In J. R. Nesselroade & H. W. Reese (Eds.), Life-span developmental psychology: Methodological issues (pp. 175–183). New York: Academic Press.
Robinson, V., & Lai, M. K. (2006). Practitioner research for educators: A guide to improving classrooms and schools. Thousand Oaks, CA: Corwin Press.
Shadish, W. R., Campbell, D. T., & Cook, T. D. (2002). Experimental and quasi-experimental designs for research. Boston: Houghton Mufflin
Sidman, M. (1960). Tactics of scientific research. New York: Basic Books.
Siegel, S. (1956). Nonparametric statistics for the behavioral sciences. New York: McGraw-Hill.
Smith, J. W. A., & Elley, W. B. (1994). Learning to read in New Zealand. Auckland: Longman Paul.
Snow, C. E., Burns, M. S., & Griffen, P. (1998). Preventing reading difficulties in young children. Washington DC: National Academy Press.
Stanovich, K. E. (1986). Mathew effects in reading: Some consequences of individual differences in the acquisition of literacy. Reading Research Quarterly, 21 (4), 360–401.
Stanovich, K. E., West, R. F., Cunningham, A. E., Cipielewski, J., & Siddiqui, S. (1996). The role of inadequate print exposure as a determinant of reading comprehension problems. In C. Cornoldi and J. Oakhill (Eds.,). Reading comprehension difficulties: Processes and intervention (pp. 15–32). Mahwah, NJ: Lawrence Erlbaum & Associates.
Statistics New Zealand. (2002). Change in ethnicity question; 2001 census of population and dwellings. Retrieved from: http//www.stats.govt.nz.
Sweet, A. P., & Snow, C E. (2002). Reconceptualizing reading comprehension. In C. C. Block, L. B. Gambrell & M. Pressley (Eds.), Improving comprehension instruction. Rethinking research, theory, and classroom practice. San Francisco: Jossey-Bass.
Sweet, A. P., & Snow, C. E. (Eds.). (2003). Rethinking reading comprehension. New York: Guilford Press.
Sykes G., & Darling-Hammond L. (2005) (Eds.), Teaching as the learning profession: Handbook of Policy and Practice (pp. 3–32). San Francisco. Jossey Bass.
Tabors, P. O., & Snow, C, E. (Eds.). (2001). Young Bilingual Students and Early Literacy Development. Handbook of Early Literacy Research. New York: Guilford Press.
Tagoilelagi-Leota, F., McNaughton, S., MacDonald, S., & Farry, S. (2005). Bilingual and biliteracy development over the transition to school. International Journal of Bilingual Education and Bilingualism, 8 (5), 455–479.
Tan, A., & Nicholson, T. (1997). Flashcards revisited: Training poor readers to read words faster improves their comprehension of text. Journal of Educational Psychology, 89, 276–288.
Taylor, B. M., Pearson, P. D., Peterson, D., & Rodriguez, M. C. (2005). The CIERA School Change Framework: An evidence-based approach to professional development and school reading improvement. Reading Research Quarterly, 40 (1), 40–69.
Taylor, B., Peterson, D., Pearson, D., Janynes, C., Knezek, S., Bender, P., & Sarroub, L. (2001, April). School reform in reading in high-poverty schools. Paper presented at the annual meeting of the American Educational Research Association, Seattle, Washington, 2001.
Timperley, H. (2003). Shifting the focus: Achievement information for professional learning. Wellington: Ministry of Education.
Timperley, H., Phillips, G., & Wiseman, J. (2003). The sustainability of professional development in literacy parts one and two. Wellington: Auckland UniServices Ltd for the Ministry of Education.
Timperley, H. S., & Robinson, V. J. M. (2001). Achieving school improvement through challenging and changing teachers’ schema. Journal of Educational Change, 2, 281–300.
Toole J. C., & Seashore, L. K. (2002). The role of professional learning communities in international education. In K. Leithwood & P. Hallinger (Eds.), Second International Handbook of Educational Leadership and Administration (pp. 245–279). Dordrecht, The Netherlands: Kluwer Academic.
Tunmer, W. E., Chapman, J. W., & Prochnow, J. E. (2004). Why the reading achievement gap in New Zealand won’t go away: Evidence from the PIRLS 2001 International Study of Reading Achievement. New Zealand Journal of Educational Studies, 39 (1 & 2), 255–274.
Wagemaker, H. (1992). Preliminary findings of the IEA Reading Literacy Study: New Zealand achievement in the national and international context. Educational Psychology, 12, 195–213.
Watkins, A. L. (1976). Samoan English: Some linguistic features of the speech of Samoan adolescents. Unpublished MA thesis. Auckland: University of Auckland.
Whitehurst, G. J., & Lonnigan, C. J. (1998). Child development and emergent literacy. Child Development 69 (3), 848–872.
Whitehurst, G. J., & Lonnigan, C. J. (2001). Emergent literacy: Development from pre-readers to readers. In S. B. Neuman & D. K. Dickinson (Eds.), Handbook of Early Literacy Research (pp. 11–29). New York: Guilford Press.
Acknowledgements
This project is the result of a close collaboration between the leaders and teachers in seven schools in Mangere and members of the Woolf Fisher Research Centre. We wish to acknowledge the professional expertise of the teachers and leaders in the schools. The achievements described in this report derive from their expert participation as partners. The support and contributions from their school communities, including their Boards of Trustees, are also acknowledged.
Colleagues from the Ministry of Education, both locally and nationally, have been involved at each stage and have been valued members of the collaboration with the schools and the researchers. We wish to thank those colleagues for their high level policy and research based contributions.
The research and development programme received funding from the Teaching and Learning Research Initiative (New Zealand Council for Educational Research), the Woolf Fisher Trust, the Schools and the Ministry of Education. This report is to the New Zealand Council for Educational Research, and we wish to thank the Director and research team for the opportunity to develop further the research and practice partnerships in South Auckland, and the approach to the management of the research funding which has enabled us to work effectively in an applied setting.
Pauline Te Kare has been critical in administering the work of the centre and the outcomes here owe a considerable amount to her skills. We also acknowledge the work of a number of research assistants, including Jolyn Tay, who helped with the data entry and data analysis, often under pressing time constraints.
The Woolf Fisher Research Centre is a centre of the University of Auckland, supported by Auckland UniServices Limited, and receives funding and support from the Woolf Fisher Trust, the University of Auckland and Manukau Institute of Technology.